
 Whatsapp
 Telegram
 2026-09-07
 Gold prices continue to fluctuate, but 4366 can still be maintained.
Gold Prices Remain Volatile, But 4366 Still Holdable
July 9, 2026, 10:56 AM
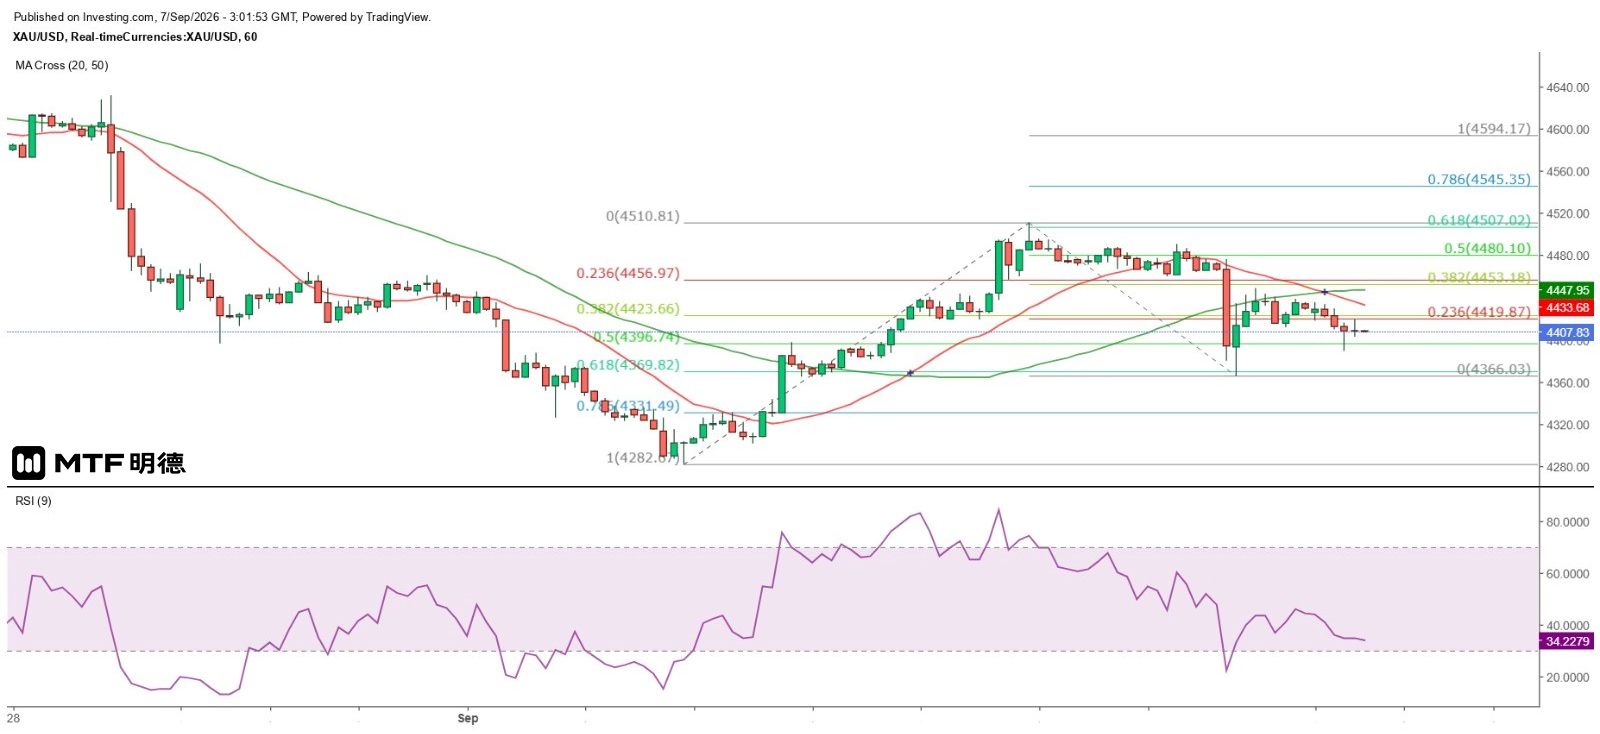
Last Friday, gold prices turned downward as expected, primarily due to strong U.S. non-farm employment data for August. The number of new jobs added in the previous month reached 162,000—nearly triple the market's expectations. Additionally, July’s job figures were revised upward from an initial decline of 23,000 to a gain of 21,000. The unemployment rate remained steady at 4.1%, while year-on-year average hourly earnings growth slightly declined from 3.2% to 3.1%. The unexpectedly robust labor market data boosted the dollar, causing gold prices to plunge by over $100 at one point. Spot gold initially dipped to a low of $4,366.03 in early New York trading before recovering noticeably.
Strong employment data does not necessarily mean the Federal Reserve will consider raising interest rates. This week’s release of August CPI data will indicate whether improvements in the labor market can translate into stronger consumer spending and further inflationary pressure. Currently, markets expect the overall CPI to remain unchanged at 3.4% year-on-year, while core CPI is projected to slow slightly from 2.5% to 2.4%. This suggests that overall inflation remains high but has not accelerated further. Meanwhile, core inflation—the Fed’s primary gauge—appears to be easing gradually, which is insufficient to push the number of FOMC members supporting a rate hike above the threshold.
However, even if inflation does not continue rising, the Fed’s lack of action on persistently high inflation provides market participants with reasons to sell the dollar and shift funds into other assets. Whenever confidence in the dollar wanes, gold becomes a natural destination (as no other fiat currency is more trusted than the U.S. dollar). Last week’s market was highly volatile, and similar fluctuations are expected this week.
After breaking above the 20-day simple moving average (SMA) on the daily chart last week—currently around $4,467—gold clearly encountered resistance and subsequently reversed sharply lower. Therefore, the 20-SMA now serves as the key short-term resistance level, while $4,366 acts as a crucial support. If this level breaks, gold could test the Gann 225-degree angle at $4,310 for further support, which is likely to offer strong resistance. For now, it appears gold should hold above $4,366 and attempt a gradual recovery toward higher levels. The large bearish candlestick peak at $4,476.35 from last Friday will act as a significant short-term resistance. Intraday price movements are expected to remain contained between $4,476 and $4,366.
The above information is for reference only and does not constitute investment advice.


