
 Whatsapp
 Telegram
 2026-08-28
 Gold prices are expected to test the 20-day line before rebounding.
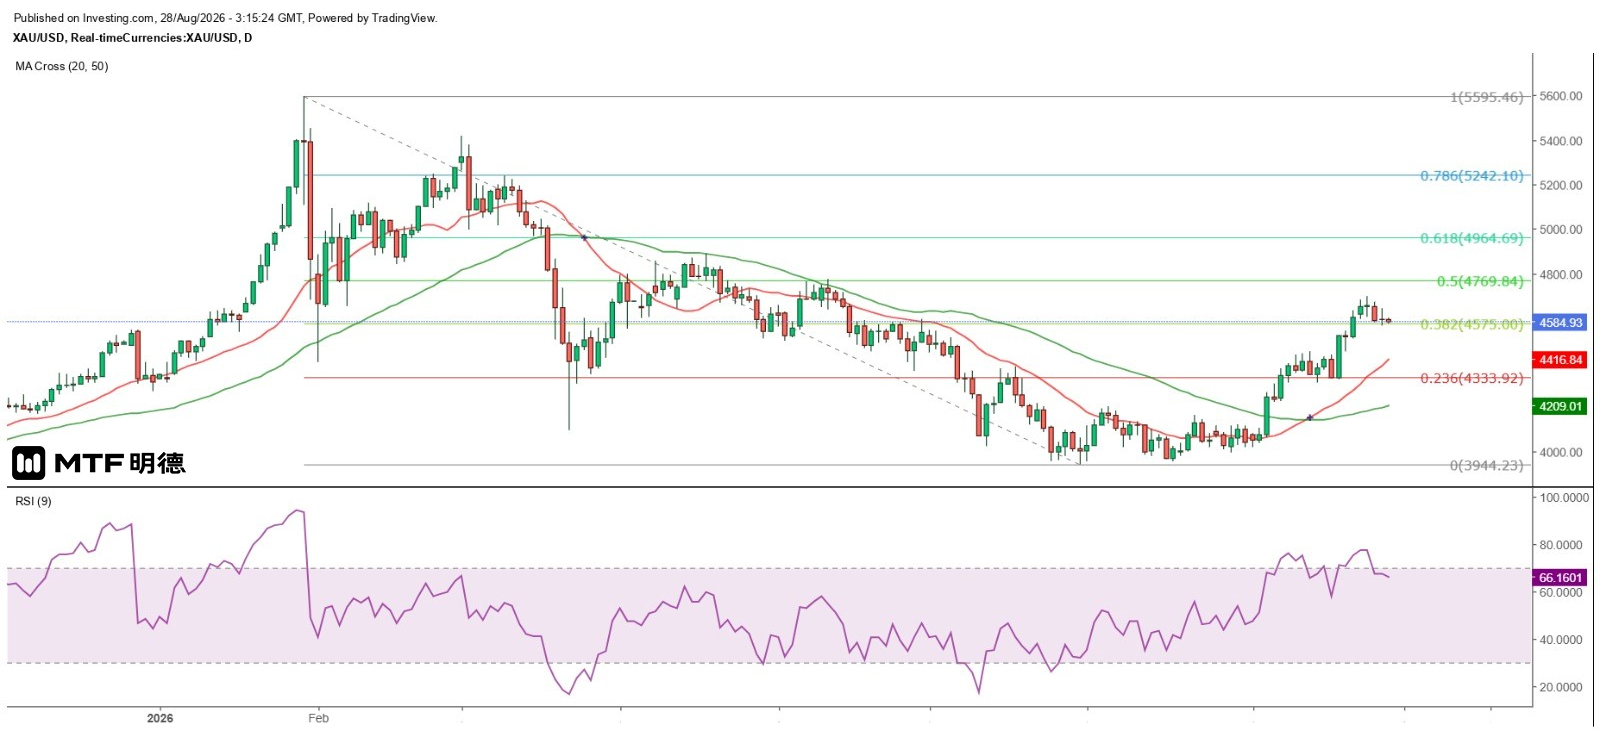
Gold price expected to test 20-day moving average before rebounding
August 28, 2026, 11:14 AM
The U.S. July PCE data showed no signs of easing inflation, continuing to weigh on gold prices. Meanwhile, three Federal Reserve officials voiced hawkish stances. Kansas City Fed President Schmid indicated that current short-term interest rates may be at a relatively loose level; Cleveland Fed President Hammack stated that the present rate levels are insufficient to bring inflation down on their own and urged policymakers to act immediately; Boston Fed President Collins added that he would support a rate hike if there were no clear evidence of sustained inflation decline.
Yesterday marked the opening of the Jackson Hole Global Central Bank Symposium, where Federal Reserve Chair Waller will speak today. Markets expect him to maintain his typically cautious and reserved approach, with several institutions predicting he will not issue any clear signals regarding the future direction of interest rates. However, in my view, Waller is not avoiding communication with markets but rather reluctant to repeat unoriginal arguments. This year’s Jackson Hole theme is "Financial Innovation," focusing on its impact on payments and policy. Given this is a central bank symposium, the relevant "policy" naturally refers to monetary policy, while "payments" relate to money flows—factors influencing overall economic activity and price movements, thereby affecting inflation. Waller may use this opportunity to discuss how financial innovation impacts inflation and monetary policy, then explain these dynamics within the current economic context, subtly reflecting potential interest rate trends.
The Fed's hawkish stance has become increasingly evident. The spot gold price peaked at $4,697.66 on Tuesday, approaching the 50% retracement level of the year's January high of $5,595.46 to the June-end low of $3,944.23, which stands at $4,769.84. On Wednesday, the market signaled another downturn, and the current rally has yet to close above $4,660. With $4,600 now breached, the next likely target is the daily chart’s 20-period SMA at $4,417. Only after testing this level could a recovery potentially resume. In the near term, $4,510 remains the immediate downside target, while resistance lies at $4,610.
The above information is for reference only and does not constitute investment advice.


