
 Whatsapp
 Telegram
 2026-11-16
Gold price may test 3810 before making an ultimate rebound.
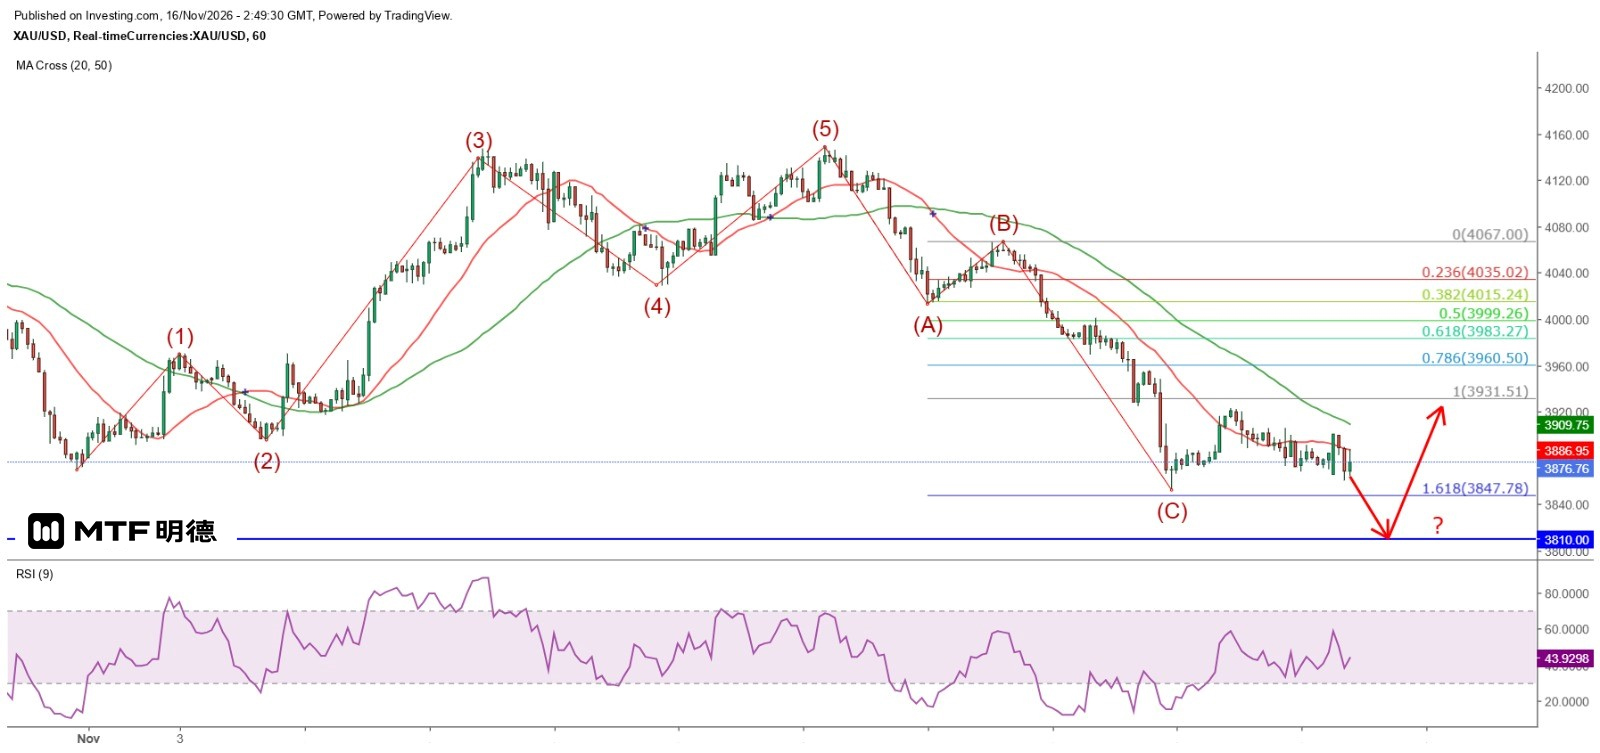
Gold Market Analysis: “Gold Price May Test 3810 Before Ultimate Rally” Drafted on 16/11/2026 10:50
After rebounding to $3,901.28 this morning, gold prices plunged sharply, hitting a low of $3,860.57 before rebounding again and currently hovering around the hourly 20SMA at approximately $3,887. This morning’s low was extremely close to the expected c-wave bottom of $3,852.81 from last Thursday, making a short-term double bottom highly likely. Therefore, we maintain our judgment from last Friday to focus on buying on dips, with a short-term target at the hourly double-bottom neckline of $3,923.16 and a measured upside target of $3,993.51.
The daily chart for gold also shows the early signs of a large double bottom. Its 20SMA has fallen to $4,010.78. From the Gann square of nine with $3,310 as the starting point, $4,010 lies at the 90-degree angle and is therefore regarded as strong resistance for gold prices, while $3,810 lies at the 0-degree horizontal angle and is viewed as strong support. In other words, gold prices are currently inclined to fluctuate between $3,810 and $4,010, and with prices currently closer to the lower end of this range, buying on dips is more appropriate.
In addition, the midpoint of the above range, $3,910, is naturally regarded as the bullish-bearish dividing line. This level currently coincides with the hourly 50SMA at $3,909.9 and is also close to the hourly double-bottom neckline of $3,923.16, so gold prices are expected to encounter their first resistance when rebounding to the $3,910–$3,923 range in the short term. Since $3,810 is the only strong support level for gold prices, investors should still be cautious of a rapid test of $3,810, which could lead to a bottom divergence with the 9RSI on both the hourly and daily charts before an ultimate rally. Investors should retain sufficient strength to enter near $3,810.
The above content is for reference only and does not constitute investment advice.


