
 Whatsapp
 Telegram
 2026-11-02
The gold price at $3810 has a high value-to-cost ratio.
Gold Market Analysis: "High Value at $3,810 per Ounce" – 2/11/2026 9:53 AM
The United States will hold its midterm elections tomorrow, with all 435 seats in the House of Representatives and 35 out of 100 Senate seats up for re-election. With some Republican lawmakers retiring or facing highly competitive districts, certain polls suggest Democrats may regain control of the Senate, while Republicans are expected to retain their majority in the House. Additionally, the U.S. Department of Labor will release the October non-farm payroll report this Friday, with expectations of a gain of 63,000 jobs. ADP will also release its private sector employment data on Wednesday, projected to show an increase of 68,000 jobs. Meanwhile, Trump's recent remarks about launching a larger-scale military operation against Iran around the time of the midterms have heightened market risk aversion.
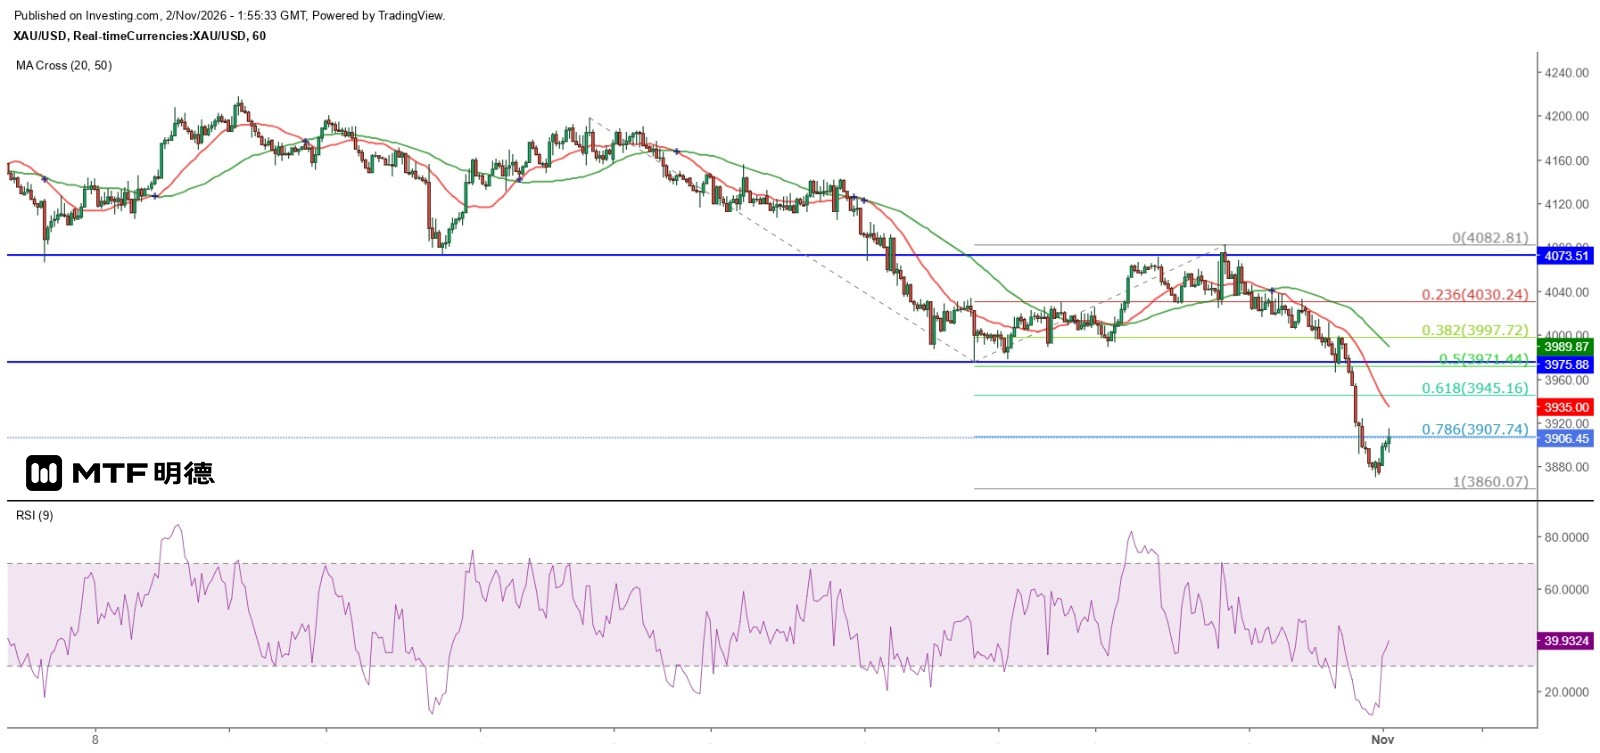
Last Friday, the three major U.S. stock indices sharply declined. The Nasdaq Composite dropped 2.86%, or over 747 points; the S&P 500 fell 1.82%, or more than 140 points; and the Dow Jones also lost over 1%. U.S. 10-year Treasury yields noticeably retreated, falling below 4.9% last Friday. Gold prices plunged by more than $150 last Friday, primarily due to rising U.S. interest rates, ongoing Middle East tensions, high oil prices fueling inflation concerns, and elevated expectations for further Federal Reserve rate hikes. I reiterate that gold is not an absolute safe-haven asset, and events such as the U.S. debt crisis are often manipulative tactics used by market players—otherwise, how could retail investors consistently fall into these traps? Isn't it evident now that when bond yields rise (i.e., bond prices fall), gold prices tend to decline?
With October ending, spot gold closed below its 20-month moving average (currently around $4,072) for the first time since October 2023. Whether this signals the beginning of a prolonged downtrend remains to be seen, but it is still a sign of weakening long-term momentum. The 20-month MA on the monthly chart will act as resistance for any rebound. This level is close to the current daily 20-day MA (around $4,087), meaning the Gann square’s 45-degree angle at $4,110 represents a key medium- to long-term resistance level, while the 90-degree angle at $4,010 marks a strong short-term resistance. In the near term, gold is likely to fluctuate between $3,960 and lower levels, with a high probability of testing or even breaking below $3,810 (a Gann square horizontal level). Nevertheless, we expect gold to hold firm above $3,810, making a trade to buy the rebound around this level relatively attractive in terms of value-to-risk ratio.
The above information is for reference only and does not constitute investment advice.


