
 Whatsapp
 Telegram
 2026-10-12
 Gold price consolidates above $4200 and is ready to break through.
Gold Market Analysis: Consolidation Above $4,200 Awaits Breakout – 12/10/2026 10:54 AM
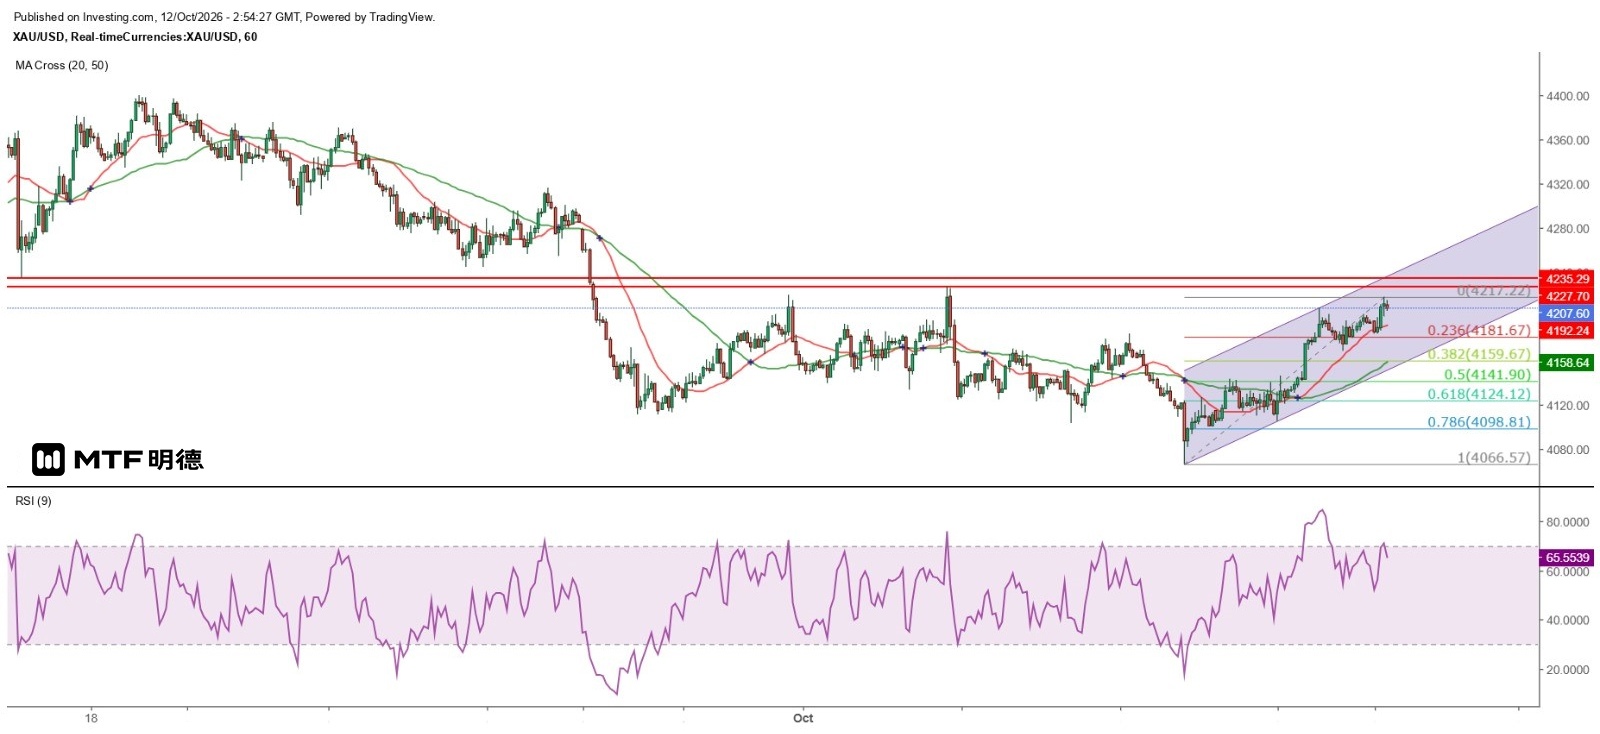
Gold prices have risen as expected, climbing sharply in early Asian trading on Friday with a strong bullish candle, reaching a high of $4,207.51 during Tokyo midday session. Although it corrected after a period of severe overbought conditions, dipping to $4,168.74 in early New York trading, the hourly chart shows that gold remains on an upward trajectory along the 20-period SMA (currently around $4,192). It regained momentum late in the New York session by breaking above $4,200 again before encountering renewed selling pressure. This morning, after briefly testing below the 20SMA, gold recovered and resumed its upward drive, reaching a temporary high of $4,217.22, followed by consolidation around the $4,210 level.
The strength in gold is linked to the U.S. easing sanctions against Russia. Russia will immediately supply 300,000 tons of diesel globally, followed by another 500,000 tons in November, then increase further by 1 million tons, and subsequently add another 3 million tons in the short term. Notably, diesel accounts for over 28% of global energy consumption—approximately 29 million barrels per day—making it the single largest fuel product. Russia is the world’s second-largest diesel exporter, having shipped about 34.2 million tons last year, equivalent to roughly 700,000 barrels daily. Even if this policy is only temporarily maintained until April next year, it is sufficient to trigger a sharp drop in international oil prices, thereby easing inflationary pressures and reducing the urgency for further Federal Reserve rate hikes—factors that naturally benefit gold prices.
At $4,210, gold has crossed the Gann 180-degree angle, which acts as a key resistance level. Having now broken through, this former resistance could turn into support, potentially paving the way for gold to target $4,310. Given the impact of the aforementioned news, gold is expected to consolidate firmly above $4,210 in the near term. On the hourly chart, the previous peak at $4,227.7 represents the first technical resistance following the $4,210 breakout, while the correction low on September 17 at $4,235.29 marks the second resistance level. Breaking above this would open the door to targeting $4,260, and eventually $4,310. Therefore, investors should remain cautious of potential rapid pullbacks in the short term. The 20SMA on the hourly chart serves as the first major support level. It is anticipated that gold will consolidate above $4,200 before breaking through $4,210 and advancing toward higher levels.
The above information is for reference purposes only and does not constitute investment advice.


