
 Whatsapp
 Telegram
 2026-09-25
 The short-term trend of gold prices may turn stronger.
Gold Market Analysis: Short-Term Price Trend May Turn Stronger
September 25, 2026, 11:10 AM (Completed)
First of all, I wish everyone a joyful Mid-Autumn Festival!
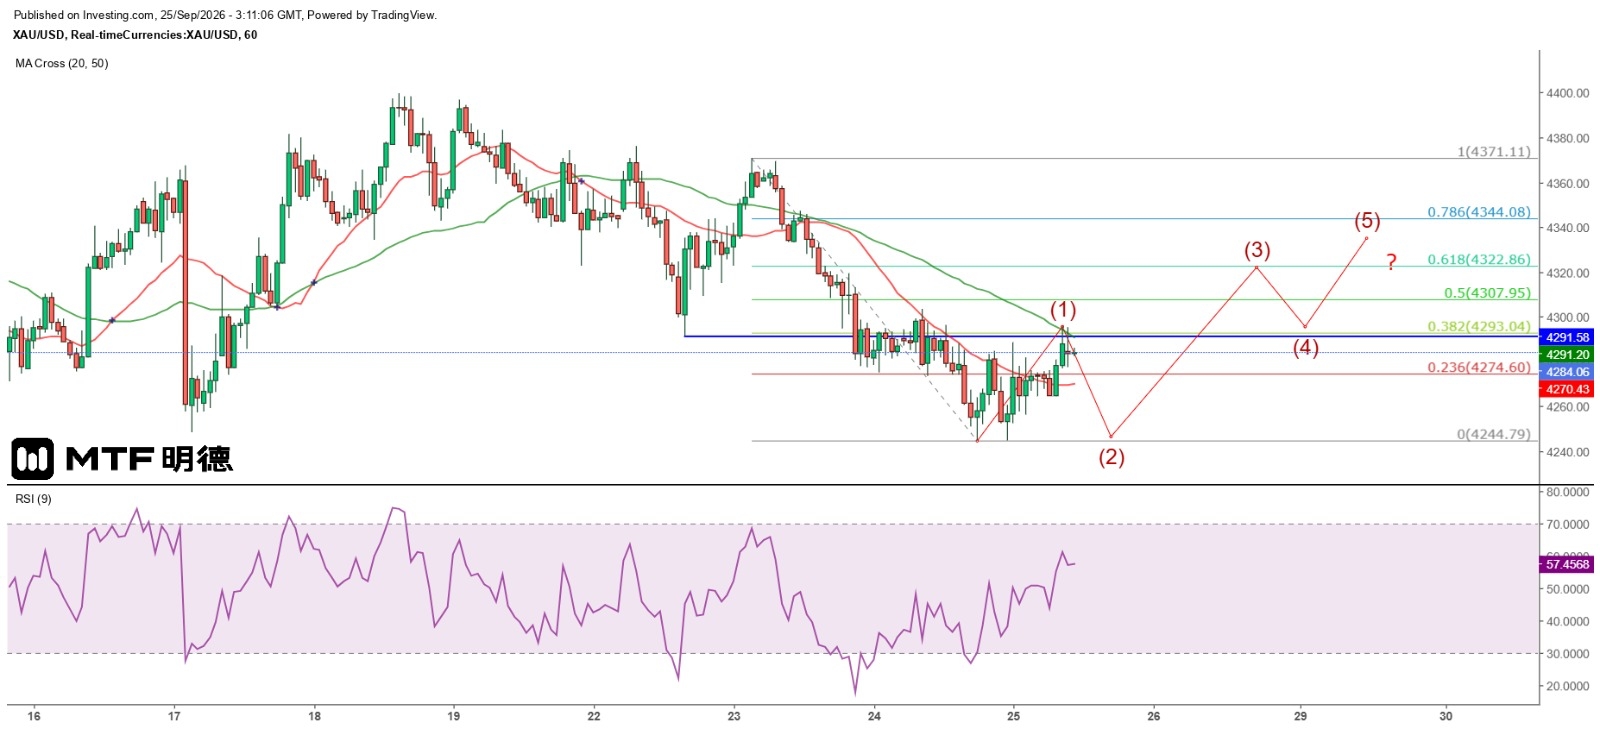
The gold price movement has largely met expectations. On the daily chart, it has closed below the 50 SMA (4317) for two consecutive days, clearly signaling a downward breakout. On the hourly chart, after touching support twice at the $4,244 level yesterday, the price formed a double-bottom rebound pattern. This morning, although it briefly broke above the hourly 50 SMA (4292) twice, it failed to close above that line on both occasions.
Overall, the rebound on the hourly chart slightly exceeded the 38.2% retracement level of the maximum decline since September 23 (4293.04), and also marginally surpassed the low of September 22 at $4,291.58. However, further gains were not achieved. The limited rebound—less than 50%—and the inability to overcome the two key resistance levels indicate that the overall trend remains weak, with bears still in control.
Nevertheless, it's worth noting that short-term cyclical patterns suggest a bottom was reached yesterday, implying a likely continuation of the rebound into next week. If today’s pullback finds support around the hourly 20 SMA (4270), or even if prices retest the $4,244 level but do not fall below $4,244.79, followed by strong bullish signals such as a piercing pattern, this would confirm a short-term strengthening trend. From a wave theory perspective, this formation could be identified as waves 1 and 2, paving the way for a powerful third wave. Next week, gold is likely to break above $4,310 and challenge the $4,360 level.
The above information is for reference only and does not constitute investment advice.


