
 Whatsapp
 Telegram
The gold price rebound wave can reach $4759.
"Gold Price Rebound Wave Could Reach $4,759" 24/3/2026 10:45 Completed
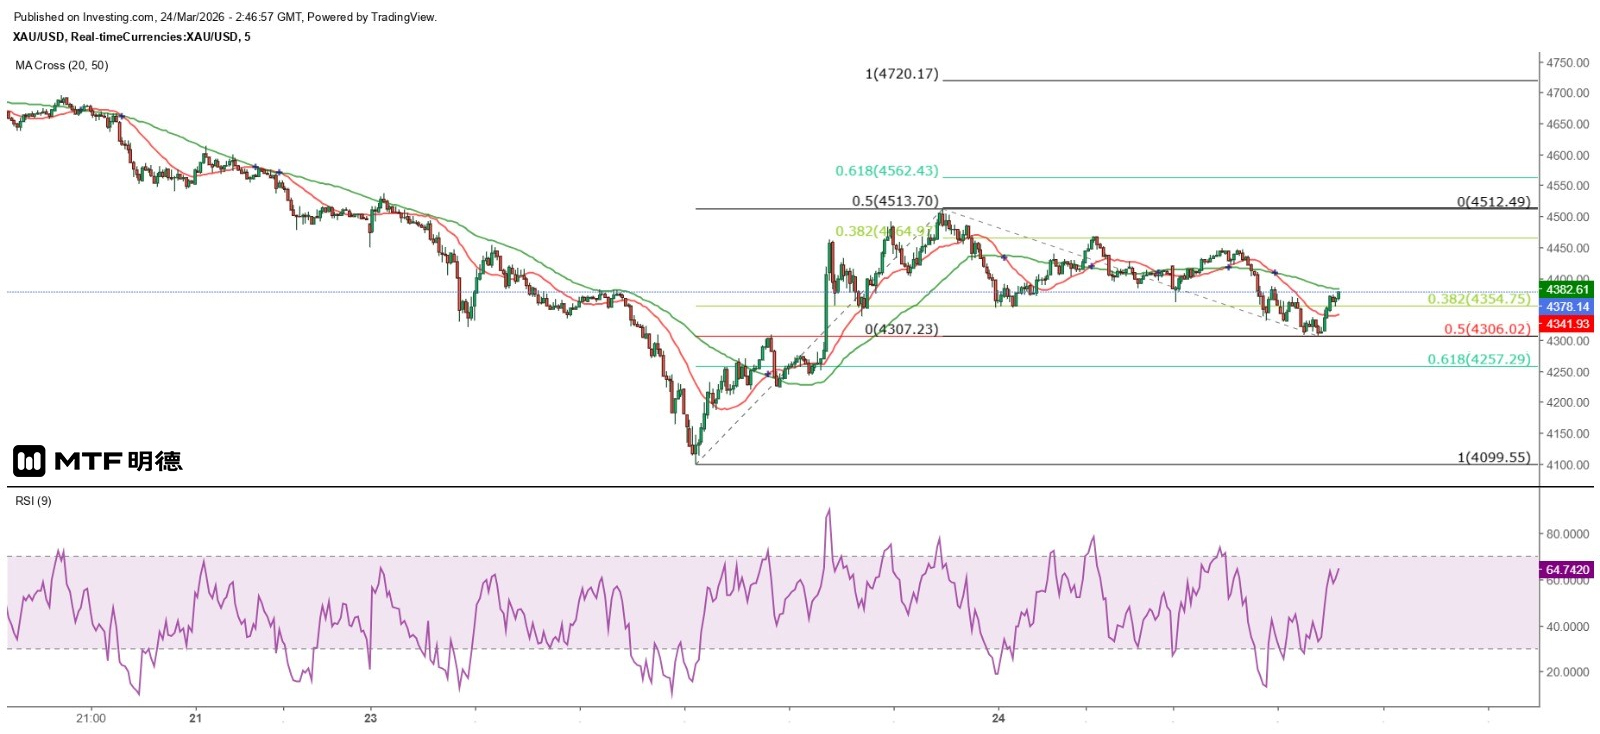
Trump's sudden policy shift towards Iran, postponing the plan to attack Iran's power plants and energy facilities for five days and indicating that the US and Iran might reach an agreement, led to a sharp drop in oil prices and a significant rebound in gold prices. Spot gold prices hit a low of $4,099.55 and then continued to rise, reaching a high of $4,512.49, but then fell again, approaching $4,300 in the early Asian market today.
It was pointed out yesterday that investors should wait for gold prices to stabilize above the 50SMA on the 5-minute chart (currently around 4387) before making a purchase. The gold price broke through this line near the midday of Europe yesterday, and after briefly dipping below it, it held above it again. Before the opening of the New York market, it rose sharply to 4462.65 US dollars, and then rose repeatedly along the 50SMA, reaching a high of 4512.49 US dollars before encountering resistance and falling back.
In fact, making profits in the gold market is not as difficult as imagined. This is because its trends follow certain patterns and do not require too many operational skills. Just referring to the moving average lines is enough to make profits. What are they? According to my observation, operating with the 20 and 50 SMA on 1 and 5-minute charts can yield a success rate of up to 80%, while the 20 and 50 SMA on the 1-hour chart can be used to determine whether the gold price is turning. Investors should note that moving average lines only work in clear upward or downward trends. If you use moving average lines in a sideways market, it is certain to cause you to blow up your account!
As of now, the rebound in spot gold prices is still some distance away from the 50SMA on the hourly chart (4486). A break above and sustained hold above this line would be necessary to consider a long position. However, as mentioned yesterday, gold prices have reached the 100% Fibonacci extension of the decline, indicating a high probability of a short-term rebound. Indeed, gold prices have rebounded by more than $400 from the low, but does this suggest that the upward momentum is waning? From the 5-minute chart, it can be seen that the low point of the adjustment this morning at $4307.23 is very close to the 50% retracement of the largest rebound since yesterday's low ($4306.02). This suggests that the rebound in gold prices has not yet ended. If it reaches the 100% Fibonacci extension, gold prices would have to rise to $4720.17 before encountering significant selling pressure. If the short-term trend continues to decline and tests the previous low of $4099.55, it could also form a double bottom pattern and rebound. The entire rebound wave in gold prices is expected to end around $4759.
The above content is for reference only and does not constitute investment advice.


