
 Whatsapp
 Telegram
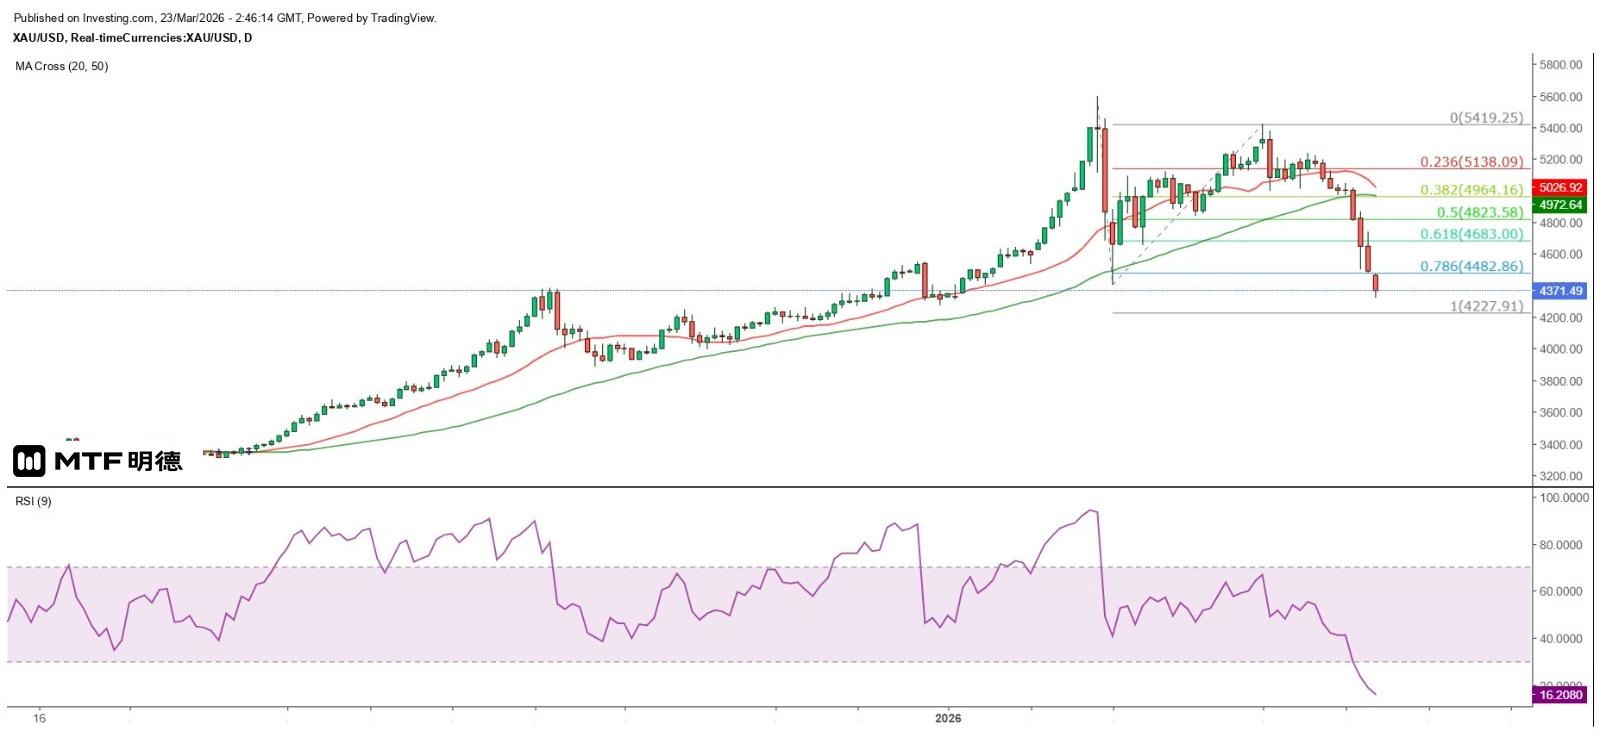
The gold price has entered a technical bear market.
"Gold Price Enters Technical Bear Market" 23/3/2026 10:44 Completed
After the gold price broke through the 50-day simple moving average (SMA) on the daily chart last Wednesday (currently around 4973), it showed no rebound strength and the decline intensified. The spot gold price further dropped to 4320.19 US dollars in the early Asian session today. Moreover, since the peak of 5595.46 US dollars on January 29 this year, the gold price has fallen by approximately 22.8% so far, meaning that it has entered a technical bear market. Measured by the Fibonacci extension line, 4227.91 US dollars represents the 100% extension of the decline on the daily chart and can be regarded as a short-term strong support level for the time being.
However, historical data shows that during the past five bear markets of gold prices, the shortest duration was 21 months and the longest was 142 months, with declines ranging from 43% to 57%. This current bear market began in January this year and has not yet reached two months, with the maximum decline being 22.8%. If the decline reaches 43%, the gold price will fall to $3,189.4. From the Gann Square perspective, $4,410 is located at the 270-degree vertical angle, which is considered a strong support (or resistance). Currently, the gold price has fallen below this level, and the 9RSI on the daily chart has dropped to 17, indicating that the gold price is in a severely oversold state and could rebound at any time due to overselling. However, $4,660 at the horizontal angle is a strong resistance.
In the short term, the rebound of the spot gold price's downward trend is still constrained by the 50SMA on the 5-minute chart (currently around 4438.6). Investors should wait for a clear break above this line before deploying a buy position. Even using the candlestick chart as a reference, it is not advisable to attempt a rebound during a bearish candle. If the gold price fails to stabilize above $4410 and continues to decline, the strong support level at $4210, which is at a 180-degree angle, should be noted. This level is slightly below the Fibonacci 100% extension of the decline, which is at $4227.91. Therefore, it is expected that if the gold price drops to the $4200 level, there is a high possibility of a strong rebound.
The above content is for reference only and does not constitute investment advice.


