
 Whatsapp
 Telegram
The gold price at $4,660 could become a strong support level.
"Gold Price at $4,660 May Serve as Strong Support" 19/1/2026 10:22 Finalized
Last Friday, the spot gold price was mostly trading between $4,590 and $4,620. It dropped sharply to $4,537.95 near the New York midday session, although it did not fall to the expected $4,510 before rebounding as predicted. The price then gradually recovered lost ground, but failed to close above $4,600. However, this morning in the Asian session, the gold price gapped higher and continued to rise, reaching a new historical high of $4,690.75. It then pulled back, hitting a low of $4,656.55 before stabilizing.
The sharp rise in gold prices is believed to be related to Trump's threat to impose 10 to 15 percent tariffs on eight European countries. The reason is that these eight countries - Denmark, Norway, Sweden, France, Germany, the United Kingdom, the Netherlands and Finland - oppose his intention to purchase Greenland. The above tariffs will be implemented on February 1st, and Trump has also stated that the tariffs will be raised to 25% from June until a comprehensive and thorough agreement on the purchase of Greenland is reached. In other words, this implies that the United States will not seize Greenland by force, and the United States is also making some deployments during the negotiation period. If the United States and its European allies go to war over this, will Greenland be protected by multiple countries in a way?
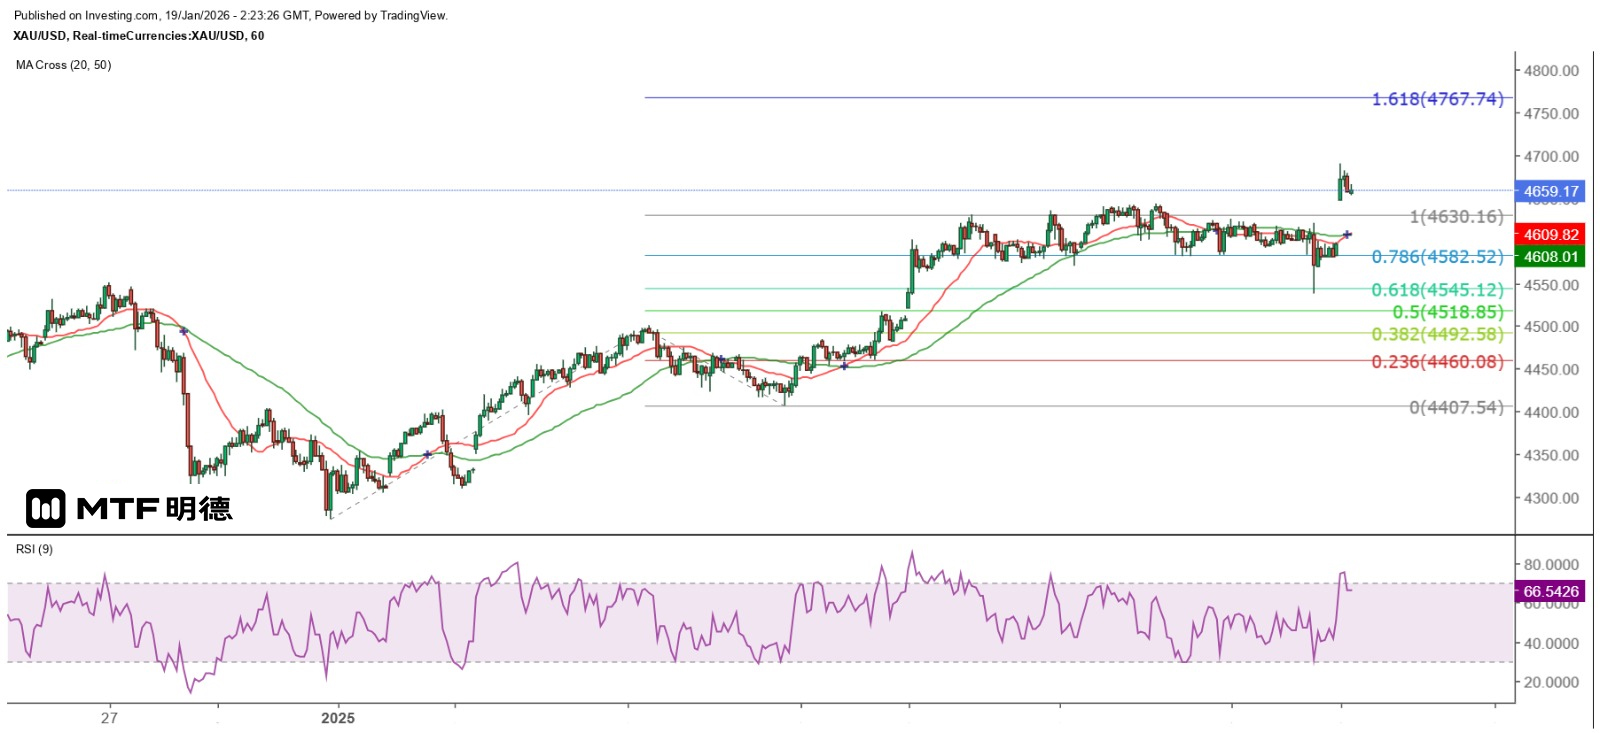
Spot gold prices broke through the top resistance of the sideways range of $4,643.18 on the hourly chart since January 12th, making this level very likely to become a strong support for short-term adjustments. Additionally, gold prices also broke through the Gann Square horizontal angle at $4,660, which is a highly significant signal. This indicates that gold has found a higher support level, and the next major resistance level is expected to be at $4,810. The possibility of a short-term challenge to $4,700 is extremely high, and it is more likely to challenge the 1.618 Fibonacci extension level of $4,767.74 on the hourly chart before a larger adjustment occurs.
The above content is for reference only and does not constitute investment advice.


