
 Whatsapp
 Telegram
Gold prices are expected to continue to fluctuate and decline.
"Gold Prices Expected to Maintain a Pattern of Repeated Declines" 4/3/2026 10:56 Completed
Yesterday, the gold price plummeted, with the spot gold price falling by nearly 385 US dollars at its maximum, marking the biggest drop since the record high in late January. The reason for this can be closely related to the political situation in the Middle East. Yesterday, I pointed out that the Middle East situation had a short-lived safe-haven effect on the gold price, but instead had a negative impact. Iran has indeed blocked the Strait of Hormuz and attacked oil tankers, rendering the waterway completely useless. This will lead to delays in oil tanker deliveries and a sharp rise in oil prices, causing funds to shift from the gold market to the oil market.
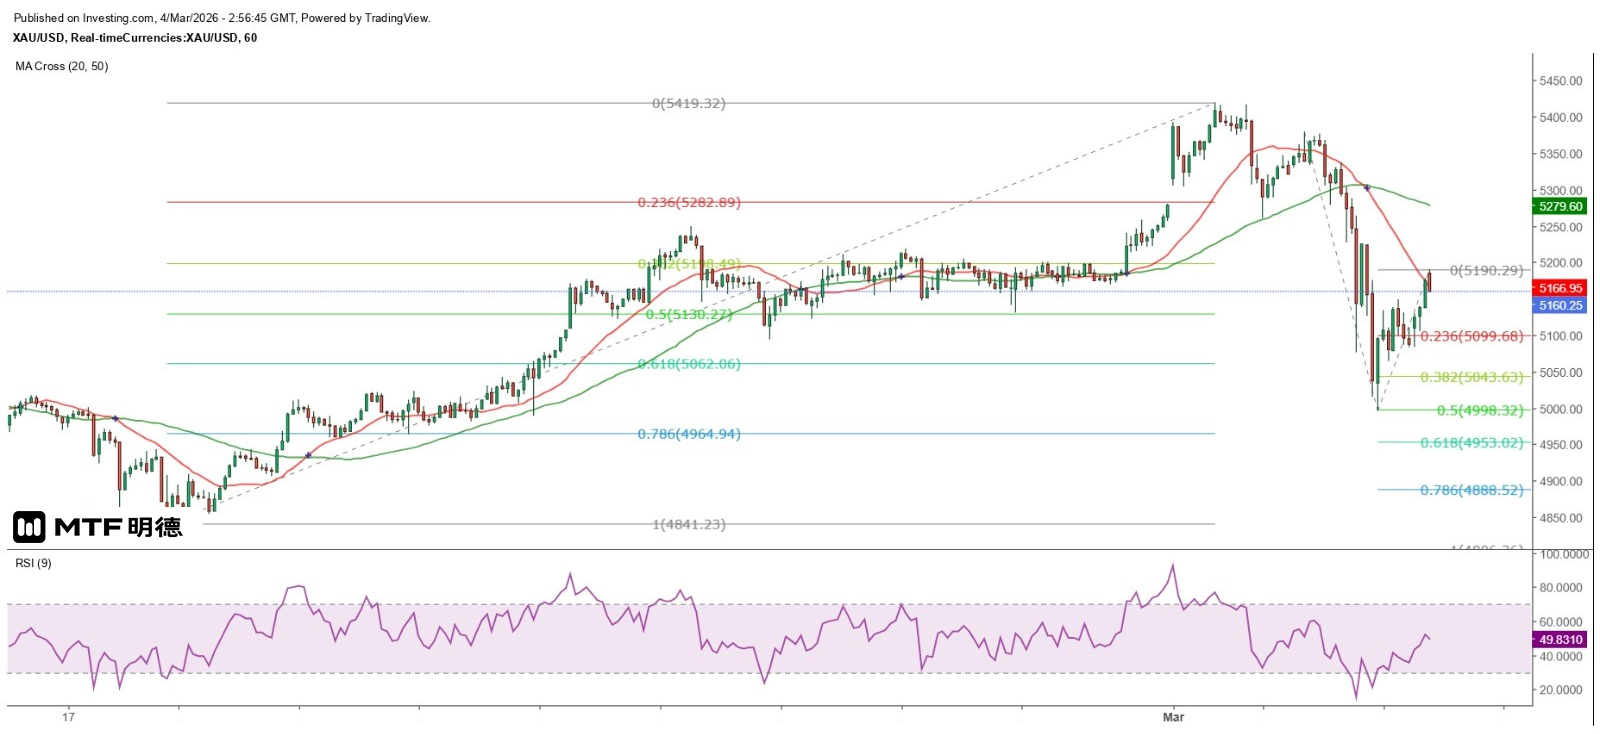
In addition, the market took this opportunity to hype up that inflation would rise as a result, reducing the possibility of the Federal Reserve cutting interest rates. The long-suspected AI bubble burst as a result, causing a sharp drop in the US stock market. The recent rebound failed to break through the $5,400 mark, and gold, which was seeking direction, became a cash-out tool. The spot gold price dropped to a low of $4,996.19 and then gradually recovered. Today, it rose to a high of $5,190.29 in the early Asian session before falling again.
Technically, the gold price uses the thousandth place as the ultimate support (or resistance). After testing the $5,000 mark yesterday and then pulling back, it can be tentatively judged that the gold price has found strong support at this level in the short term. However, it should be noted that the decline yesterday was relatively large, and a strong rebound after testing the $5,000 mark was not unexpected. Nevertheless, the gold price resumed its decline from $5,190 this morning. The high point this morning was slightly higher than the median of yesterday's range at $5,188.11, indicating that the gold price may have completed its rebound. Even if the target is set at $5,000, there is still an operating space of $190.
If the Fibonacci extension lines are used to measure the movement since yesterday's high, a 100% decline would bring the gold price down to $4,806.36, while a 50% drop would see it fall to $4,998.32. Based on this, there is a possibility that a double bottom could form around $5,000, or the price could break through the February 17th low before rebounding strongly. From the Gann Square perspective, the gold price entered the 90-degree range at $4,960 yesterday, thus encountering strong support. The rebound high reached $5,190, which is relatively close to the 180-degree angle at $5,260 (far from the 135-degree angle at $5,110).
Therefore, it is estimated that the gold price will remain within a range of 300 dollars between 4960 and 5260 dollars in the short term. In the short term, the gold price has now fallen below the 20SMA on the 5-minute chart (currently about 5169.5), and there is a greater chance of testing the 50SMA (currently about 5141.7). It is expected to rebound afterwards and challenge the 20SMA, and 5190 dollars is likely to be the intraday high. The trend is expected to remain volatile and downward.
The above content is for reference only and does not constitute investment advice.


