
 Whatsapp
 Telegram
Gold and silver are expected to continue to rise in an upward trend despite breaking through the previous highs.
Gold and Silver Break Records Again, Expected to Rise with Volatility 14/1/2026 10:29 Completed
Gold and silver prices have remained strong, both breaking through their previous highs and invalidating my prediction yesterday that they had peaked. This morning in the Asian market, silver reached a high of $89.96. Gold also hit a high of $4,634.29 in the early part of the New York market yesterday, setting a new all-time high. However, it gradually declined and closed at a low of $4,569.77. This morning, it has rebounded and reached a high of $4,620.73.
I believe that the geopolitical situation is the main reason for the new highs of gold and silver and their maintenance in a high range of fluctuations. However, its impact can be extremely short-lived. Subsequently, the market can continue to push up the gold price based on the further decline of the US interest rate. On the other hand, CME will also continue to increase the margin of gold and silver to curb speculative activities. Therefore, the overall trend of gold and silver is expected to be a repeated and fluctuating upward movement.
From the hourly chart, gold prices have shown a sideways movement at a high level. The expected range of fluctuation is between 4,560 and 4,660 US dollars. Assuming that the gold price has held steady at 4,600 US dollars, it is likely to fluctuate within the range of 4,600 to 4,660 US dollars. However, 4,633.21 US dollars still poses resistance. Only by breaking through and holding steady above this level can there be a chance to challenge 4,660 US dollars. Otherwise, the gold price may fluctuate around 4,610 US dollars within a range of 50 US dollars, that is, within the aforementioned larger range.
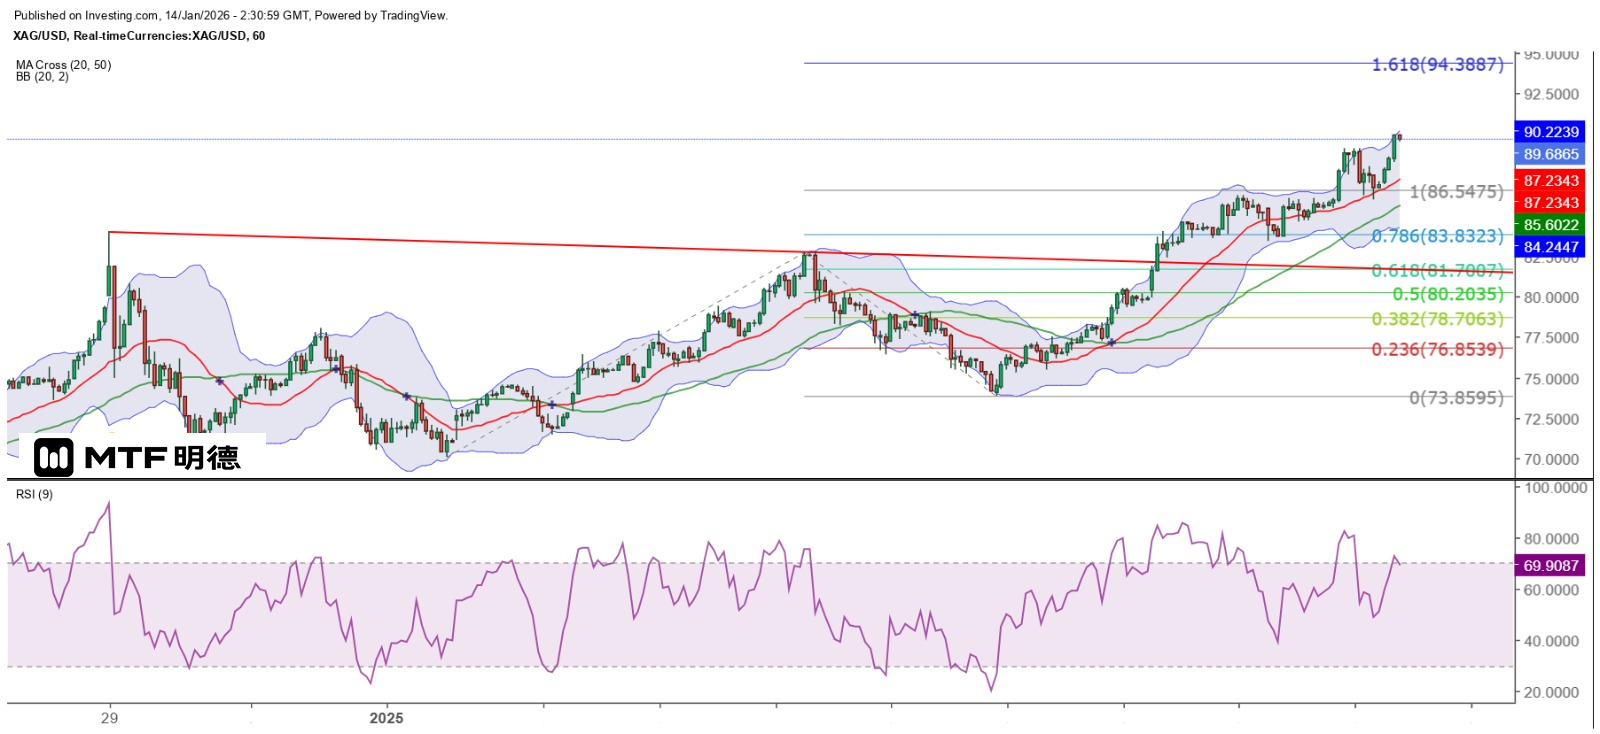
Silver at $89 is likely to find support.
As for the silver price, $89 is expected to be a strong support level for the day. However, the current hourly chart trend shows a slight divergence with the 9RSI, and it is close to the top of the Bollinger Band. The price may gradually test the lower level during the day. But if it only falls gradually with small candle bodies, it may develop into an ascending flag pattern, increasing the possibility of breaking the previous high. Therefore, the 50SMA on the 5-minute chart (currently around $89.19) should be the first important support level. If it is broken, then see if $89 can hold. Finally, the 20SMA on the hourly chart (currently around $87.24) should be the ultimate profit target.
The above content is for reference only and does not constitute investment advice.


