
 Whatsapp
 Telegram
 2026-09-08
 Gold price remains stable at 4410 and is poised to break through.
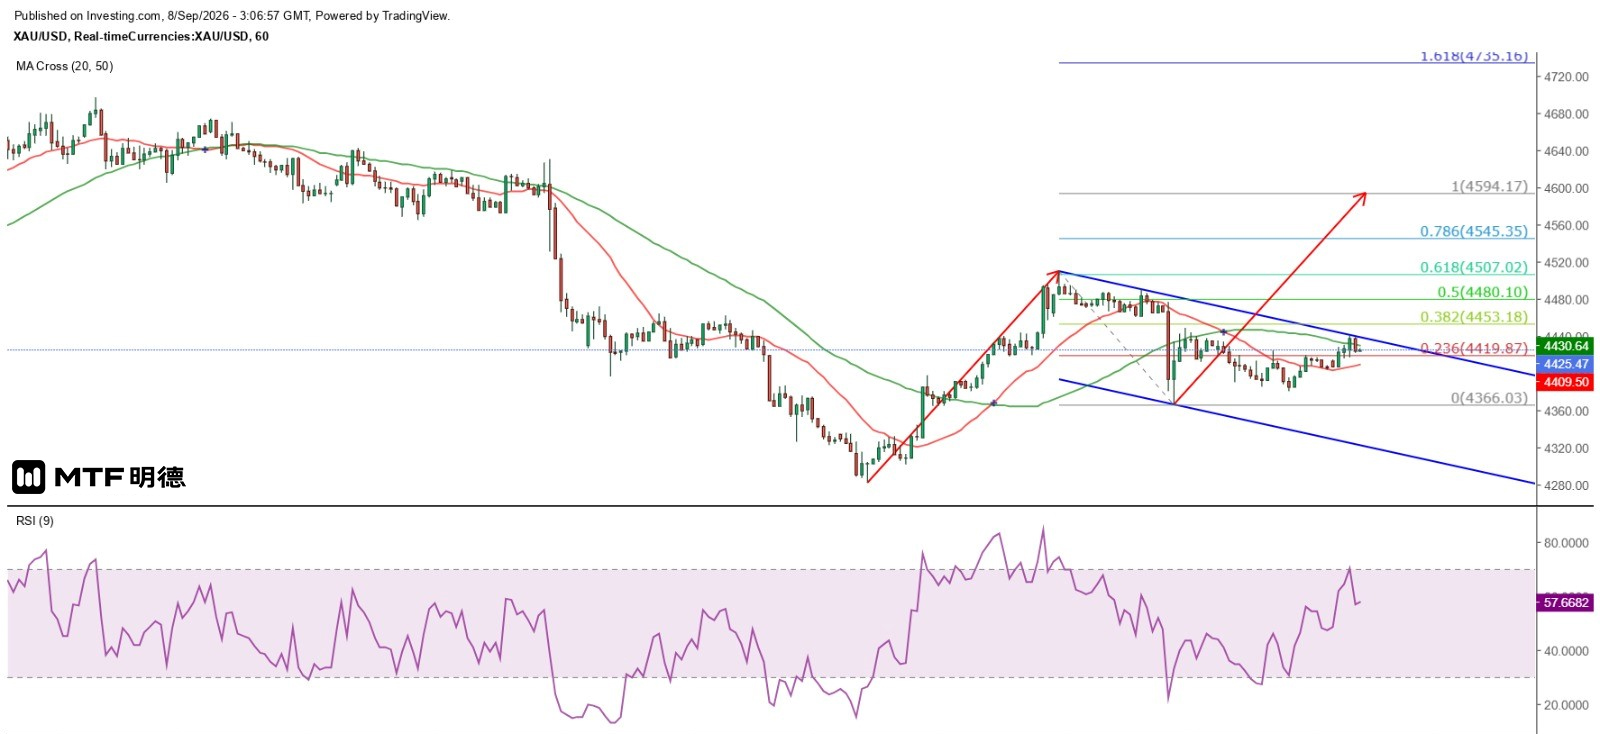
"Gold Price Holds Steady at 4,410, Set for an Upward Breakout" – Completed on 8/9/2026 at 11:04
Yesterday, spot gold prices remained weak during the European morning session, dipping as low as $4,381.23 before stabilizing and gradually recovering. In the early New York session, it broke above the hourly 20SMA (currently around $4,409), then pulled back to consolidate before opening higher with a gap in today's Asian market, further strengthening to $4,440.84—surpassing the hourly 50SMA (currently around $4,432). However, on the hourly chart, gold is clearly constrained by a descending trendline drawn from the high of $4,511 on September 3, forming a bearish double-hourly reversal pattern.
The technical resistance facing gold reflects traders' lack of clear direction, indicating a need for fresh market signals. ADP will release its latest weekly private-sector employment data tomorrow. Last Friday’s market reaction to stronger-than-expected non-farm payrolls was brief, suggesting skepticism about the Fed raising interest rates at next week’s meeting. Logically, if the Fed did not cut rates due to the initial July non-farm jobs drop of 23,000, why would it raise rates based on a single month of 162,000 job gains in August? Therefore, the ADP weekly employment report is likely to cause volatility rather than trigger a breakout.
Regarding gold, it currently appears to be near the top of a balanced descending channel, while the double-hourly reversal suggests a higher probability of renewed downward movement. Short-term cyclical patterns indicate that the downtrend may reverse on Wednesday, though whether this will be triggered by weaker-than-expected ADP data remains to be seen. Additionally, the U.S. August PPI and CPI reports are scheduled for release this Thursday and Friday, respectively. I believe that if these figures meet expectations, the likelihood of a Fed rate hike next week will diminish. Moreover, would FOMC members supporting a rate hike suddenly increase from three (rotating members) to seven? Investors should therefore consider the possibility of a bullish move in gold. Once it breaks through the hourly descending trendline resistance, using Fibonacci extension at 100% of the move since September 2, gold could rise to $4,594.17. The hourly 20SMA at $4,409 will become a key intraday support level—coincidentally close to Gann’s square vertical angle at 270 degrees, offering strong support.
The above information is for reference only and does not constitute investment advice.


