
 Whatsapp
 Telegram
 2026-08-18
 The gold price correction is still dominated by buying at lower prices.
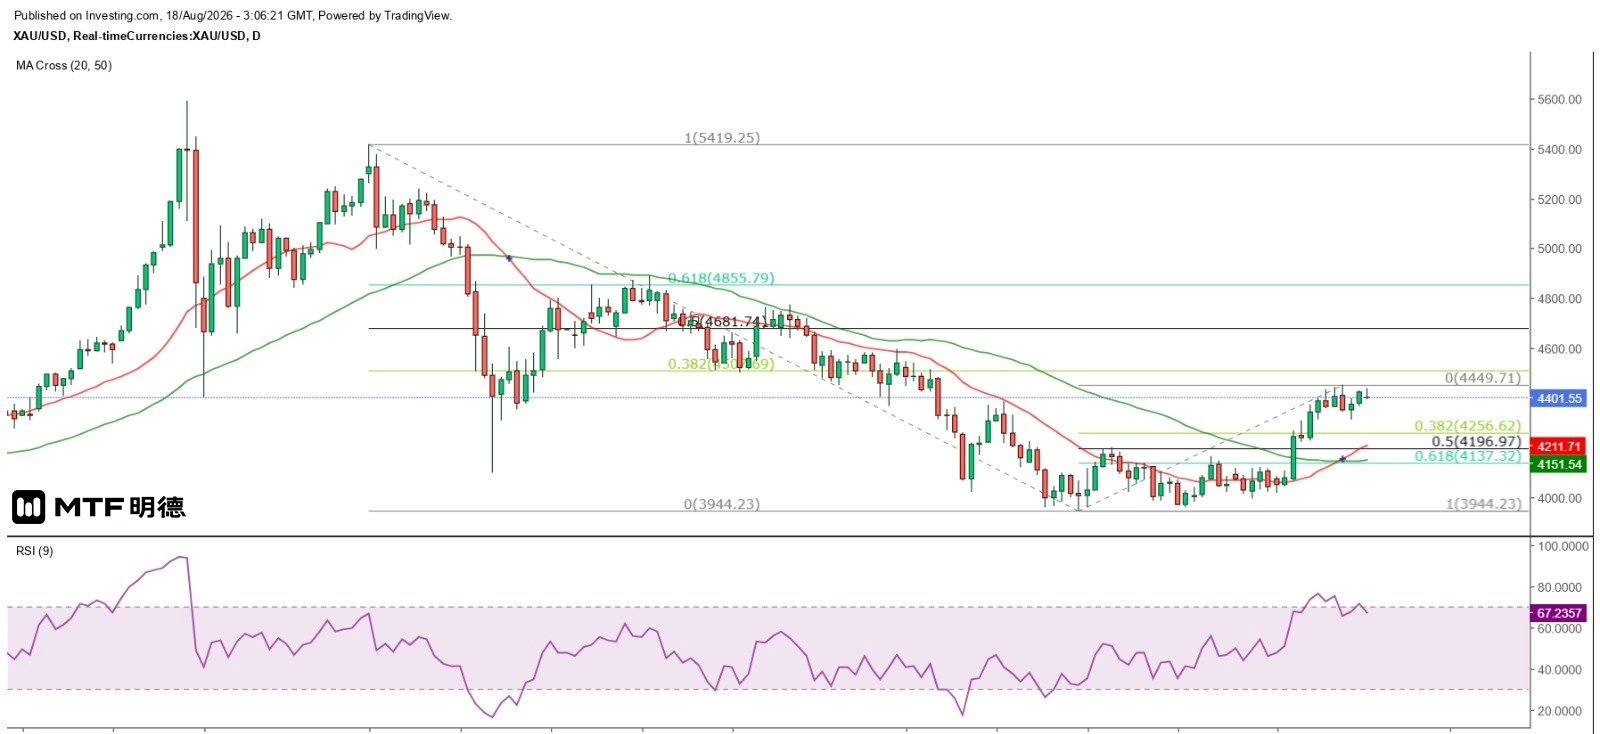
"Gold Price Retracement: Still Primarily Buy on Dips" – Completed on 18/8/2026 at 11:03
In the blink of an eye, the 60-day temporary ceasefire and negotiation deadline between the U.S. and Iran expired yesterday. Not only has no nuclear deal been reached, but passage through the Strait of Hormuz remains partially restricted. U.S. President Trump is expected to abandon further negotiations with Iran, and foreign media report that the U.S. will reimpose oil sanctions and maritime blockades against Iran. Last week, U.S. Treasury Secretary Yellen stated that unprecedented financial sanctions against Iran are imminent.
Yesterday, Brent crude futures rose back above $90 per barrel, while New York's front-month crude held steady around $84. Spot gold prices fluctuated upward yesterday, reaching a high of $4,436.15 in early Asian trading this morning before retreating. On the hourly chart, a strong bearish "head-and-shoulders" reversal pattern emerged. Although gold did not follow the balanced downward channel as previously indicated, it now appears more likely to have formed a double-top pattern on the hourly chart—suggesting a short-term trend toward continued correction. The neckline is seen at $4,311.22, with a simple measured target for the decline at $4,186.29.
From a Gann square perspective, if gold confirms a break below $4,410 (a vertical angle at 270 degrees), it could test the double-top measured target of $4,186.29, meaning the 180-degree angle level at $4,210 would come under pressure. Even if we interpret the current movement as sideways rather than a double top on the hourly chart, a breakout above $4,449.71 would be required to break the stalemate.
However, the daily chart outlook is less pessimistic. Recent price declines merely reflect a pullback after reaching the 50% retracement level from the largest drop since April 17, initiating a corrective wave. Moreover, gold has significantly pulled away from both the 20-day and 50-day moving averages, creating ample room for a pullback. Therefore, investors may consider establishing long positions during this short-term correction. Taking June 30’s low as the start of the recent rally, potential entry points could include the 38.2%, 50%, and 61.8% Fibonacci retracement levels at $4,256.62, $4,196.97, and $4,137.32 respectively. In summary, until gold clearly breaks below the 50-day SMA on the daily chart, waiting for lower levels to buy remains the primary strategy.
The above content is for reference only and does not constitute investment advice.


