
 Whatsapp
 Telegram
 2026-08-13
 Gold prices are awaiting a breakthrough, with cautious optimism.
"Gold Price Awaits Breakout with Cautious Optimism" – Completed on 13/8/2026 at 11:06
Yesterday, the U.S. Department of Labor released July CPI data, showing an annual increase of 3.4%, down from June's 3.5%. The core CPI also slowed slightly to 2.5% year-on-year from 2.6%. However, these figures are insufficient to ease the Federal Reserve’s vigilance on inflation or prompt any rate cuts. Yet gold prices surged sharply. I find it highly勉强 to explain this move solely by CPI data; instead, oil-related developments appear to be the primary driver behind gold’s rapid rise.
Yesterday, the U.S. Energy Information Administration (EIA) reported that crude oil inventories increased by 17.423 million barrels in the week ending August 7, reaching 424.4 million barrels—the highest level since 2023. Additionally, EIA’s monthly report released on the same day projected that natural gas production—accounting for 40% of the U.S.’s primary electricity generation—will hit a new record this year. Production in the first half of 2026 was already up 4% compared to the same period last year. The United States has been the world’s largest natural gas producer from 2009 through 2024.
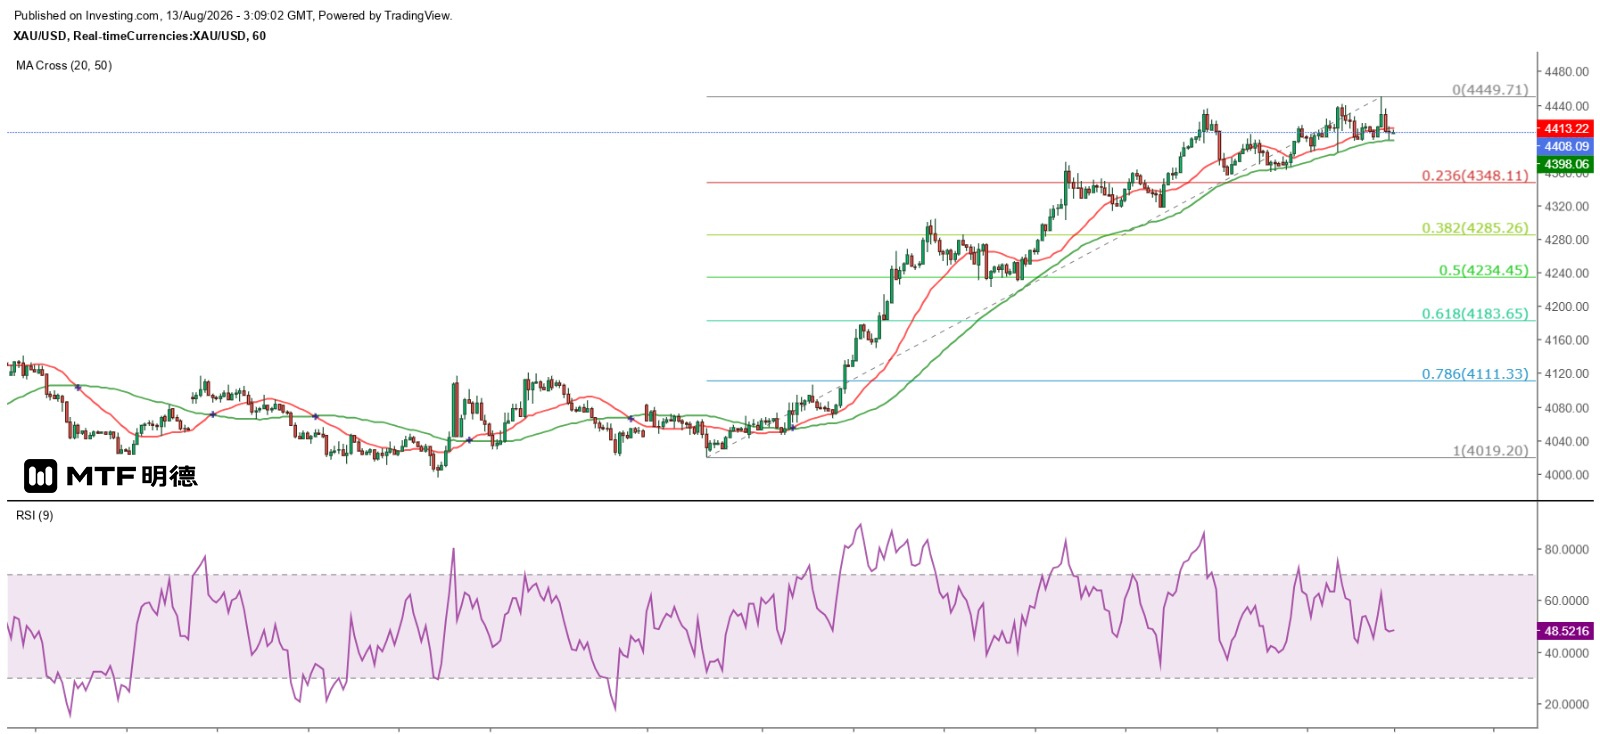
Based on this, investors likely believe that U.S. inflation will decline as a result, reducing the risk of sustained upward pressure and thereby lowering the likelihood of further Fed rate hikes. For gold, spot prices have clearly stabilized above $4,000. However, they remain near the 50% retracement level of the largest drop since April 17, meaning technical correction risks remain high. That said, if even such inflation data fails to push gold lower, investors should watch closely: once gold firmly reclaims above $4,410, there is a strong chance it could test the Gann 180-degree angle at $4,210, potentially triggering a larger corrective wave.
On the other hand, the hourly chart of spot gold suggests significant downside potential. If prices close below the 50SMA ($4,398), they may test $4,285 or even $4,234—or possibly $4,183—before regaining momentum. Meanwhile, on the daily chart, the 20SMA ($4,159.7) has already crossed above the 50SMA ($4,147.2), so around $4,163 can be considered a key medium-term support level.
The above information is for reference only and does not constitute investment advice.


