
 Whatsapp
 Telegram
 2026-08-04
 The probability of the gold price breaking through the 4120 level is relatively high.
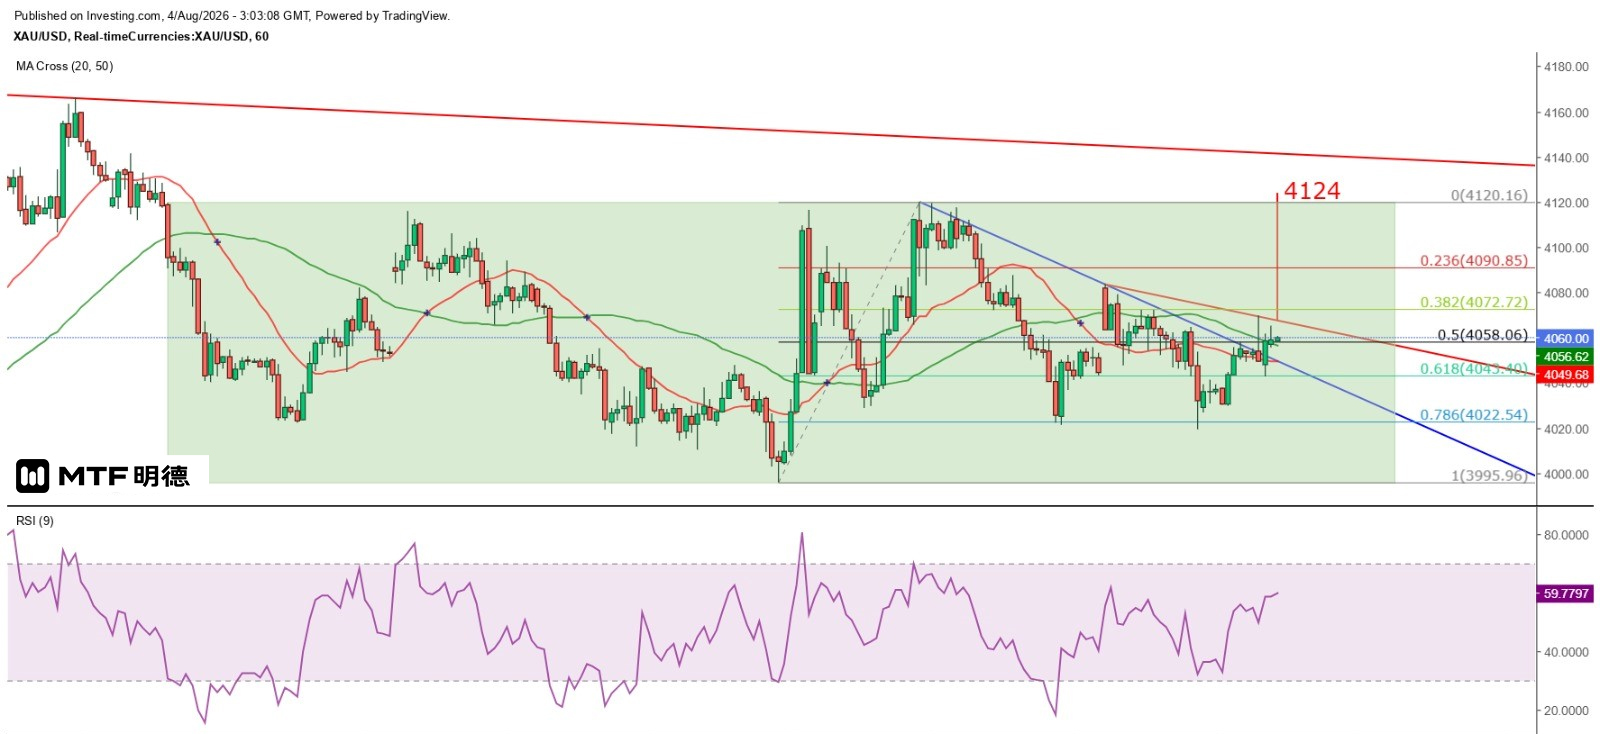
"Higher Chance of Gold Price Breaking Above 4,120" – Completed on April 8, 2026, 11:02
With Trump postponing a new attack on Iran, market expectations have shifted toward the possibility of renewed negotiations between the two sides. As a result, international oil prices declined and gold prices rose. On Monday, New York crude futures opened lower with a gap down, falling below $80 at one point to hit a low of $78.46 before hovering around $81 currently. Meanwhile, spot gold initially dipped to $4,019.2 in early trading in New York yesterday, then stabilized and rebounded during the midday session after consolidating at lower levels.
Overall, gold prices continue to fluctuate around the 20SMA on the daily chart (currently at approximately 4059). This morning, they reached a high of $4069.45 in early Tokyo trading and once again broke above the 50SMA on the hourly chart (currently at around 4057), suggesting a potential strong rebound. According to TD count analysis, if gold confirms a breakout above the descending trendline resistance on the hourly chart, the next target would be around $4124—slightly above the resistance level of $4120, which marks the upper boundary of the main price range since July 24 on the hourly chart.
Observing the price range, gold is currently near the midpoint of the aforementioned sideways zone (4058.06). Although theoretically the chances of moving up or down are equal, the hourly chart shows that three recent lows are extremely close together, suggesting a sense of hesitation—either falling further or rebounding. Therefore, it is more likely that prices will continue to rise. In the short term, the key resistance level is at $4,120. However, once this level is breached, a significant number of stop-loss orders are expected to trigger, further pushing prices higher. As such, we anticipate stronger resistance at the Gann square's 180-degree angle at $4,210. For intraday trading, buying on dips remains the primary strategy.
The above information is for reference only and does not constitute investment advice.


