
 Whatsapp
 Telegram
 2026-07-31
 Gold price has the potential to continue testing its low levels today, with a high chance of success.
Gold price likely to test lower levels intraday 31/7/2026 11:17 Completed
Yesterday, the U.S. released its second-quarter GDP preliminary estimate, showing a year-on-year quarterly growth of 1.5%, down from 2.1% in the first quarter. Non-residential investment growth slowed from 10.6% in Q1 to 8.4%, while AI-related industry growth decelerated from 13.8% to 8.8%. Exports declined from 10.9% to 4.5%, whereas consumer spending increased more sharply, expanding from 0.5% to 3.2%. Nevertheless, overall data indicates a slowdown in economic growth.
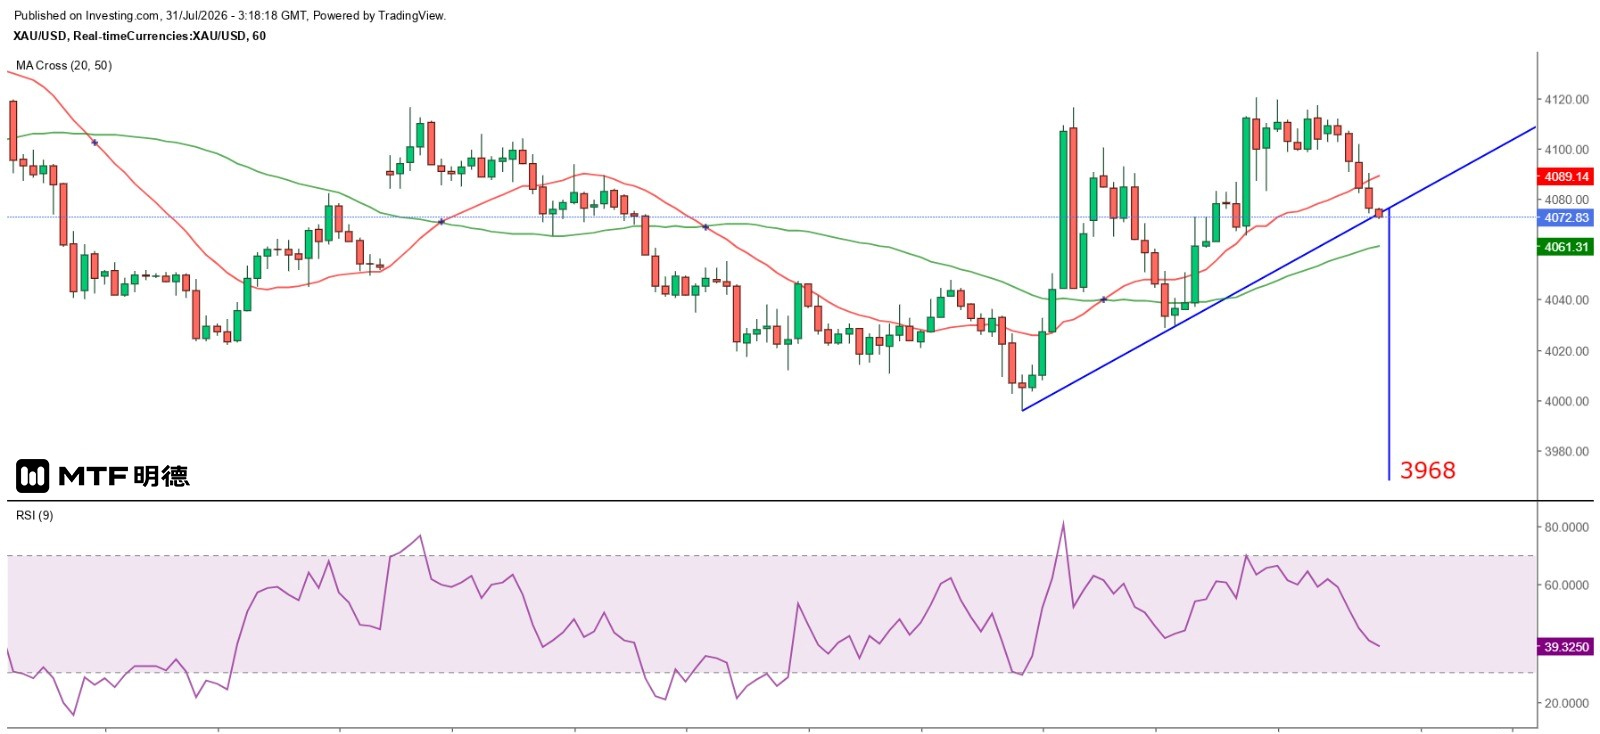
Data briefly boosted gold prices, with spot gold reaching $4,120.16 early in New York trading—slightly surpassing the high set after the Federal Reserve's interest rate decision. However, amid rising expectations of a rate hike, gold maintained its upward momentum and held firm at higher levels before declining again this morning in Asian markets, falling back below $4,100. As seen on the hourly chart, since the start of this week, gold has attempted three times to break above $4,110 but failed each time, indicating that it will likely remain stuck in a sideways consolidation pattern in the short term.
Tonight, the U.S. will release the July University of Michigan Consumer Sentiment Index, expected to rise from 49.5 to 54.4, moving back above the neutral threshold. If the data indicates stronger consumer confidence and subsequent inflationary pressure, the likelihood of a Federal Reserve rate hike would increase, further weighing on gold prices. Gold is expected to remain under pressure today, testing lower intraday levels, with the hourly 50SMA (4061.34) likely serving as the first major support.
The gold price is currently testing the upper trendline on the hourly chart. Although a false breakout is more likely, if the price closes below the 50SMA on the hourly chart over time, the downside target measured by the TD count would be $3,968, and a new TD demand line would need to be calculated only upon its formation. Even from the 5-minute chart perspective, gold remains constrained by the 20SMA, and a reversal of the downtrend seems unlikely before the price breaks above the 50SMA (currently around $4,091). The key resistance level for the day remains at $4,110.
The above information is for reference only and does not constitute investment advice.


