
 Whatsapp
 Telegram
 2026-06-04
 Gold prices are expected to continue to rebound in the short term.
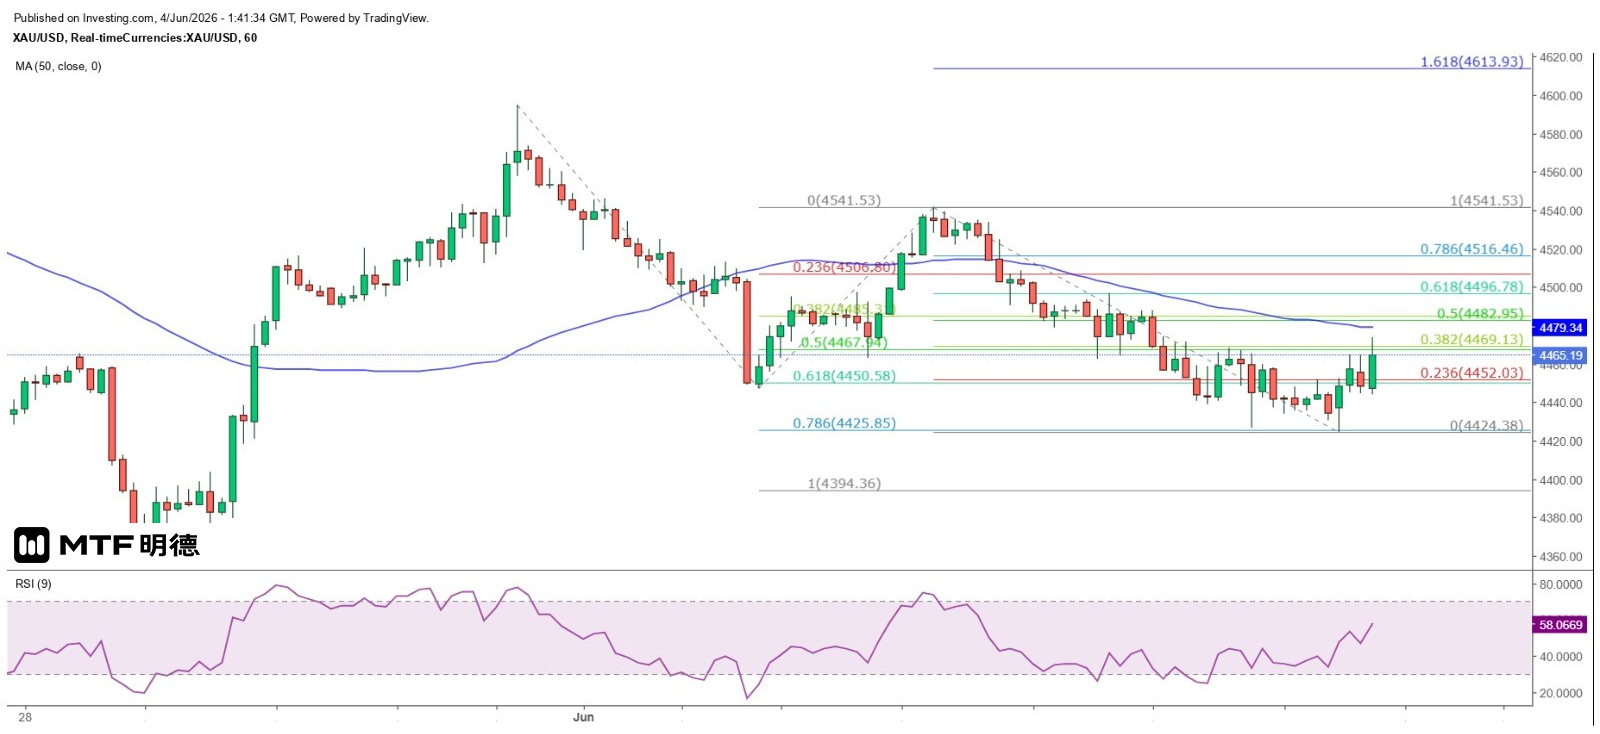
Gold prices are expected to continue rebounding in the short term.
Completed on 4/6/2026 at 9:40 AM
Gold prices continued to decline yesterday, with spot gold briefly dropping as low as $4,426.9 in early trading in New York. Although it later surged significantly, it failed to reclaim the one-hour high of $4,465.6 before falling again. However, after touching a low of $4,424.38 this morning, spot gold formed a bullish engulfing pattern within an hour, consolidating and then further rebounding to $4,473.6, confirming yesterday's prediction of a bottoming-out reversal.
As seen on the hourly chart, the recent drop in gold prices since June 2 represents 78.6% of the largest decline recorded between May 29 and June 1. Today's low also forms a double bottom pattern with yesterday's low, suggesting that gold is likely to continue its short-term rebound. The first major resistance lies at the 50-period SMA (currently around $4,479). The 50% retracement level of Tuesday’s largest decline stands at approximately $4,483, marking the next higher resistance, while the 61.8% retracement level at around $4,497 is expected to present stronger resistance.
If gold price manages to hold above the 50-period SMA on the hourly chart, it could potentially target the Gann Square 335-degree angle at $4,510. Only a break and sustained close above this level would open the door for further upside toward the previous consolidation zone high of $4,580, and even the strong resistance at the Gann Square horizontal level of $4,660. Given that gold has clearly formed a double bottom around $4,420, with $4,410 serving as a key support, buying on dips remains the primary strategy. However, stop-loss orders should be placed if $4,410 is breached, or even $4,400.
The above content is for reference only and does not constitute investment advice.


