
 Whatsapp
 Telegram
The gold price is currently in a triangular formation awaiting a break.
Gold price forms a short-term triangle pattern awaiting breakout – May 22, 2026, 11:00 AM
Reports indicate that the U.S. and Iran are very close to reaching an agreement; however, U.S. Secretary of State Rubio stated he cannot accept Iran's charging of vessels passing through the Strait of Hormuz. Let's see if there is good news after the weekend!
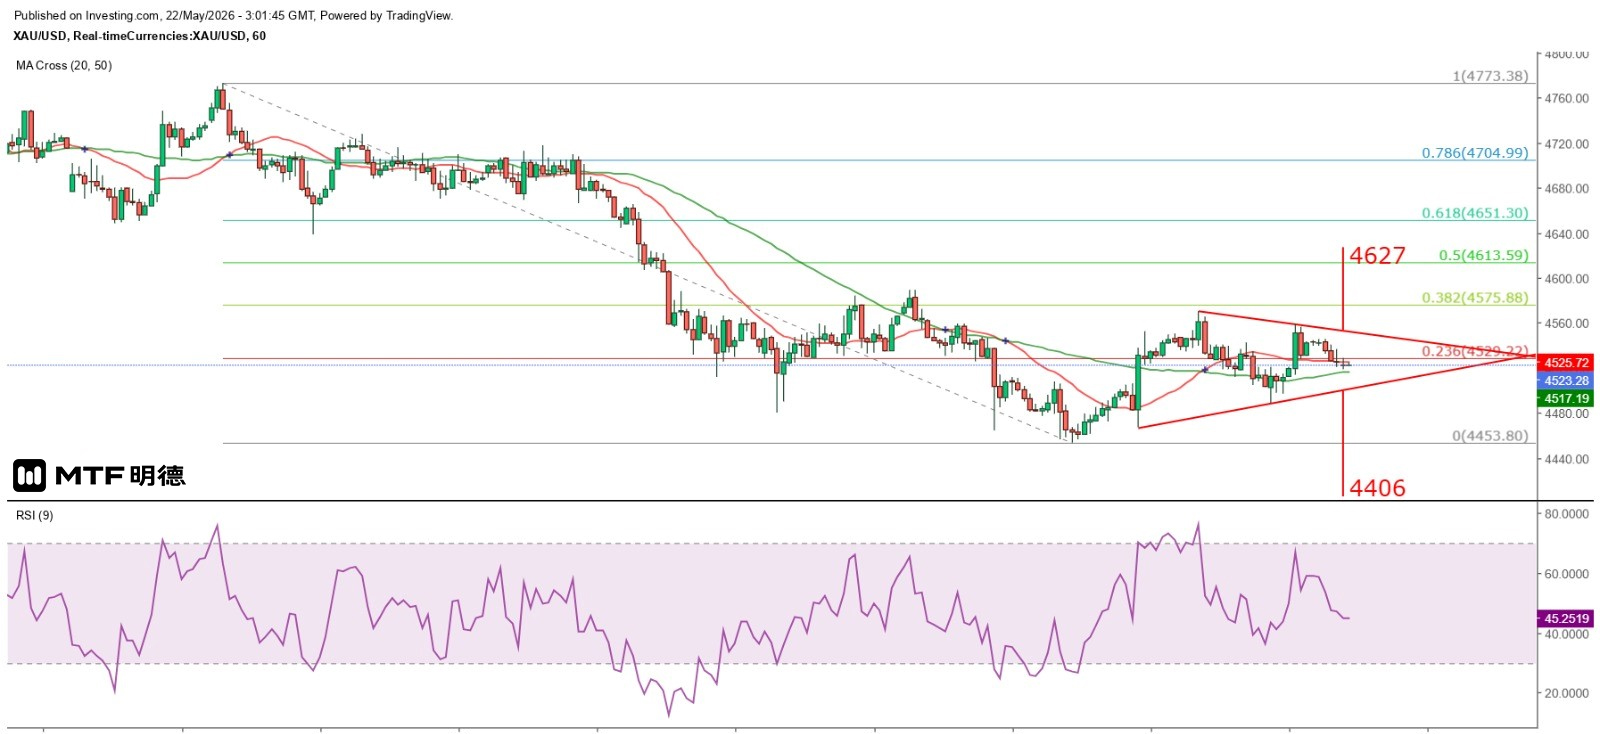
With expectations of a soon-to-be-ended military confrontation between the U.S. and Iran, crude oil prices returned below $100, while Brent crude briefly fell near $102. Spot gold prices fluctuated above $4,500. On the hourly chart, gold broke above $4,500 on Wednesday evening with a large bullish candlestick, but after reaching a high of $4,570.85 in early Asian trading yesterday, it continued to decline. It later rebounded after hitting a low of $4,520.92 in early New York trading, only to retreat again after peaking at $4,559.30 following London's close. This morning, it dropped near the 50SMA (4,510) before stabilizing temporarily.
On the chart, gold is gradually forming a narrowing triangle pattern on the hourly chart, poised for a breakout, with a higher probability of breaking above the descending trendline. Measured by the TD count, if it breaks above the descending line, the projected upside target would be around $4,627; conversely, if it breaks below the ascending line, the downside target would be approximately $4,406. However, as time progresses, both targets will converge toward the center of the triangle—meaning the aforementioned levels represent the maximum potential targets. Should new TD counts emerge, the ascending or descending lines would need to be reset accordingly. For now, I still maintain that the rebound momentum will continue into early next week.
The above information is for reference only and does not constitute investment advice.


