
 Whatsapp
 Telegram
Gold price continues to rise but is still constrained by the 50-day moving average.
"Gold Price Rebounds but Remains Below 50-Day Moving Average" 9/4/2026 10:43 Finalized
Hours after the US and Iran reached a temporary ceasefire agreement, Israel launched an air strike on Lebanon on Wednesday, reportedly killing at least 254 people, the largest since the conflict began. Israel said the temporary ceasefire agreement did not include Lebanon, and US White House Press Secretary Judd Deere pointed out that Lebanon was not included in the agreement and had made it clear to all parties. US Vice President Pence also emphasized in an interview in Budapest on the same day that the US had never promised to include Lebanon in the ceasefire arrangement and said that the relevant claims might be a misunderstanding. Subsequently, many countries issued statements, saying that the temporary ceasefire agreement should include Lebanon in the conflict area. However, Iran then announced the re-blockade of the Strait of Hormuz.
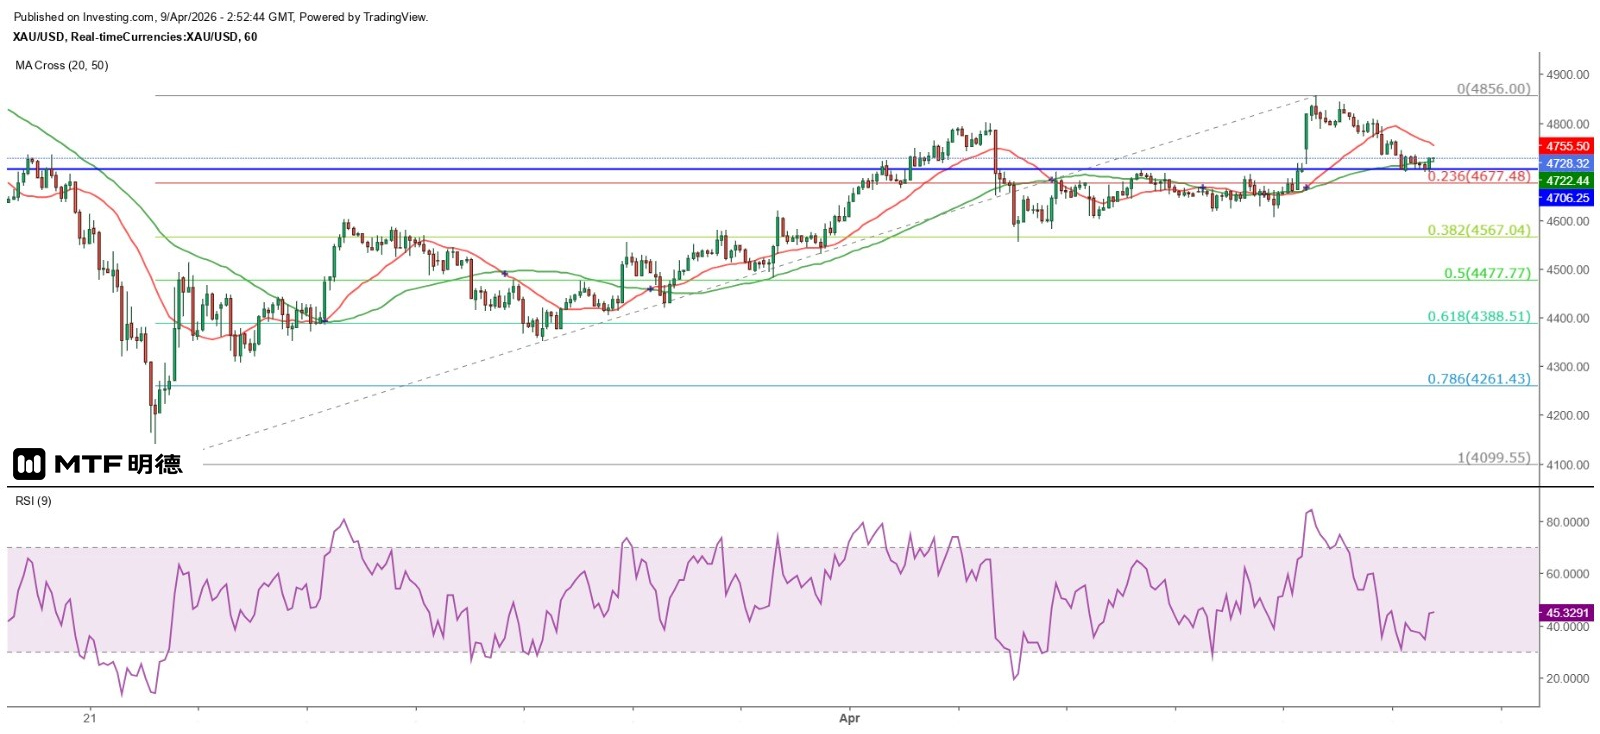
The incident led to a further decline in gold prices. Spot gold prices bottomed out at $4,699.65 in the late New York session yesterday before stabilizing. This morning in the early Asian session, although it has regained a foothold above $2,700, it remains in a sideways trend. Technically, gold prices have fully filled the gap from yesterday's rise, and the possibility of a new rise is relatively high. Moreover, the three major U.S. stock indexes still rose significantly yesterday, and although the euro against the U.S. dollar pulled back, it still held onto half of its gains and rose slightly this morning. The market's lukewarm response to Israel's air strikes on Lebanon indicates that investors believe the United States will eventually agree to include Lebanon in the temporary ceasefire agreement, and the Strait of Hormuz will be reopened.
As for the gold price, from the hourly chart, it is observed that the gold price has found strong support at around $4,700, which is also the top of the sideways range from April 2nd to 7th. It is believed that this level has become a short-term strong support. From the Gann Square, the larger fluctuation range is expected to be between $4,660 and $4,860, while from the Gann angle, it is between $4,660 and $4,810. Yesterday, the gold price dropped sharply from the high, which is believed to be due to approaching the 50SMA on the daily chart (currently around $4,900). Therefore, even if the gold price rises further in the short term, this line remains a medium-term resistance. Don't forget, the gold price has re-entered a bear market!
The above content is for reference only and does not constitute investment advice.


