
 Whatsapp
 Telegram
The gold price has broken through the $5,200 mark - an opportunity with high potential.
"High Chance of Gold Price Breaking Through $5,200" 6/3/2026 10:40 Completed
After entering the European market yesterday, the spot gold price failed to reach a new intraday high and remained in a sideways pattern. It plunged sharply at the beginning of the New York opening and hit a low of $5,051.14 in the second half of the afternoon session. It then gradually rebounded. This morning, in the early Asian session, it rose sharply and returned above the $5,100 level. The current high is $5,144.05.
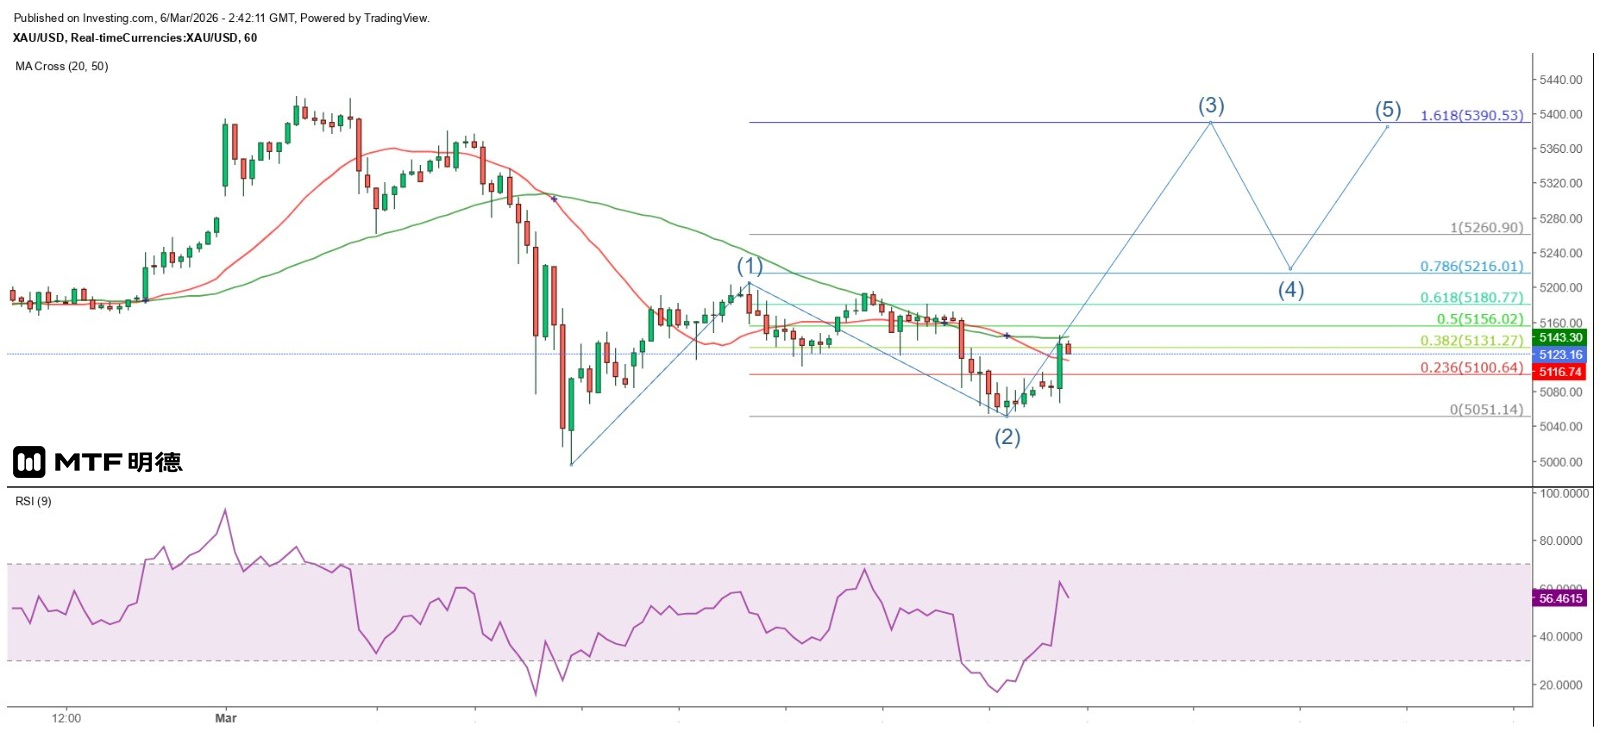
The hourly chart of gold prices clearly does not show an ascending triangle as predicted yesterday, but rather a double top pattern, with the top at $5,205.91. Traders' strategy seems to be to break through the neckline at $5,109.19 and target the previous low at $4,996.15, creating a higher-level double bottom pattern. Alternatively, from the perspective of wave theory, a second wave decline is unfolding. This morning, gold prices rebounded significantly, suggesting that the short-term corrective wave may have ended and that it is likely to rise with the release of the US February non-farm payroll data and the Federal Reserve's FOMC meeting on March 17 and 18.
Assuming that the gold price has completed the second wave adjustment as expected on the hourly chart and has entered the third wave, the gold price is bound to break through $5,205.91. Calculated based on the third wave's increase being 1.618 times that of the first wave, the gold price will rise to $5,390.53. Based on the Fibonacci 100% extension, the gold price will also rise to $5,260.90. $5,260 is exactly at the 180-degree angle of the Gann Square, which is a strong resistance level.
Therefore, the current judgment is that the short-term adjustment of the gold price is very likely to have ended. The next target will be to challenge $5,205.91, and if it breaks through, it will then aim for $5,260. If it encounters resistance and falls back, $5,200 will be regarded as an important support level. Eventually, it will rise to $5,390.53 before another pullback. The target of the fourth wave adjustment is close to but not lower than $5,205.91. Currently, the gold price is still constrained by the 50SMA on the hourly chart (currently around $5,117). If it breaks above this line intraday, the probability of the subsequent development as expected will be relatively high.
The above content is for reference only and does not constitute investment advice.


