
 Whatsapp
 Telegram
The price of gold is expected to break through the $5,200 mark.
"Gold Price Expected to Break Through $5,200" 25/2/2026 10:44 Completed
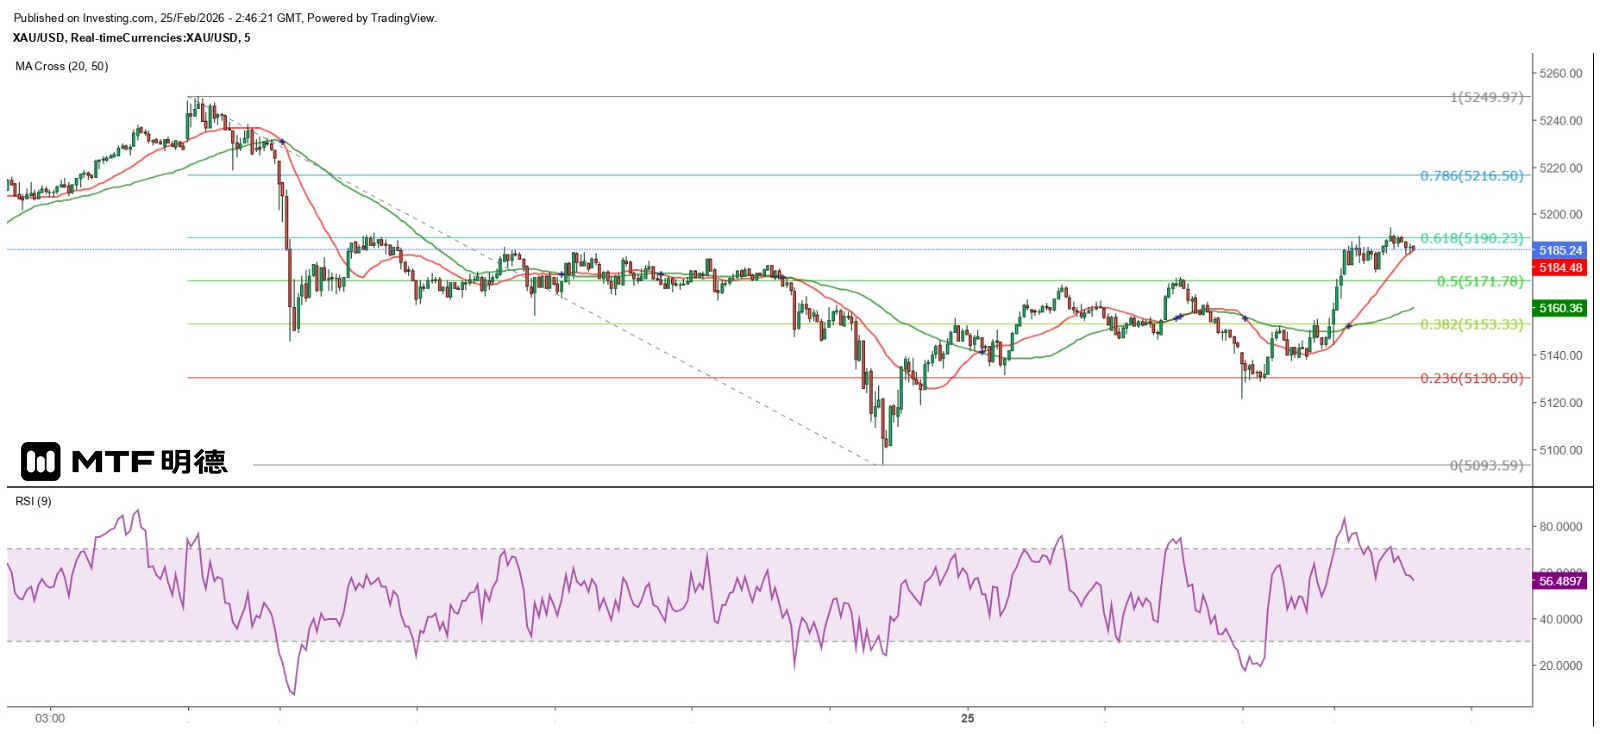
Yesterday, the spot gold price was mostly trading between $5,055 and $5,185 in the Asian session. However, it plunged sharply at the beginning of the New York session and briefly fell below $5,100, hitting a low of $5,093.59 before rebounding. It then encountered resistance at around $5,173 towards the end of the New York session and retreated. This morning, in the early Asian session, it dropped to $5,121.57 but soon strengthened again, continuously reaching intraday highs above $5,190. It has now surpassed the rebound high of $5,191.93 from yesterday's sharp decline in the Asian session. $5,200 is expected to be a key technical resistance level for the day. If it is broken through, the gold price is likely to embark on a strong upward trend.
From the hourly chart, it can be seen that the gold price has shown single-hour reversal signals both in the early New York session yesterday and in the Asian session this morning. It has also been in a pattern of each wave being higher than the previous one. Currently, it is challenging the 61.8% retracement level of the biggest decline since yesterday, which is at $5,190.23. As this level is also the top resistance of the main consolidation range yesterday and is close to the psychological level of $5,200, it is expected to encounter significant resistance. However, if it breaks through this level, the top of the large bearish candle formed in the early Asian session yesterday at $5,222.6 will be the target for this rebound wave. Further upward, it may challenge the 180-degree angle of Gann Square at $5,260.
In fact, the low point this morning was already significantly above the 135-degree angle of $5,110, indicating that gold has regained its footing above $5,100. Currently, the probability of the price moving towards $5,260 is relatively high. The median between the two, $5,185, can be regarded as the dividing line between bullish and bearish trends. Meanwhile, $5,147.5 (the median between $5,110 and $5,185) is an important support level. Therefore, even if the gold price fluctuates below $5,185, as long as it remains above $5,147.5, it cannot be said to be weakening. Additionally, the 20 and 50 SMA on the 5-minute chart can be seen as strong support or reversal points. Investors should not set their stop-loss levels above these two SMAs. On the contrary, when the gold price drops to either of these SMAs, it can be considered a buying opportunity.
The above content is for reference only and does not constitute investment advice.


