
 Whatsapp
 Telegram
The price of gold at $4810 is expected to be a resistance point for the rebound.
"Gold Price at $4,810 Likely to Be Resistance for Rebound" 2/2/2026 10:25 Completed
Last Friday, the prices of gold and silver plunged sharply in a single day. Spot gold dropped by 530.5 US dollars, with the maximum decline reaching approximately 714 US dollars. Spot silver fell by nearly 21 US dollars, with the maximum decline approaching 32 US dollars. This was the day with the largest single-day depreciation in history. Technically, after this significant drop, the 9RSI overbought levels on the monthly charts of spot gold and silver slightly decreased to 87.7 and 93.7 respectively, but they still remained at severely overbought levels.
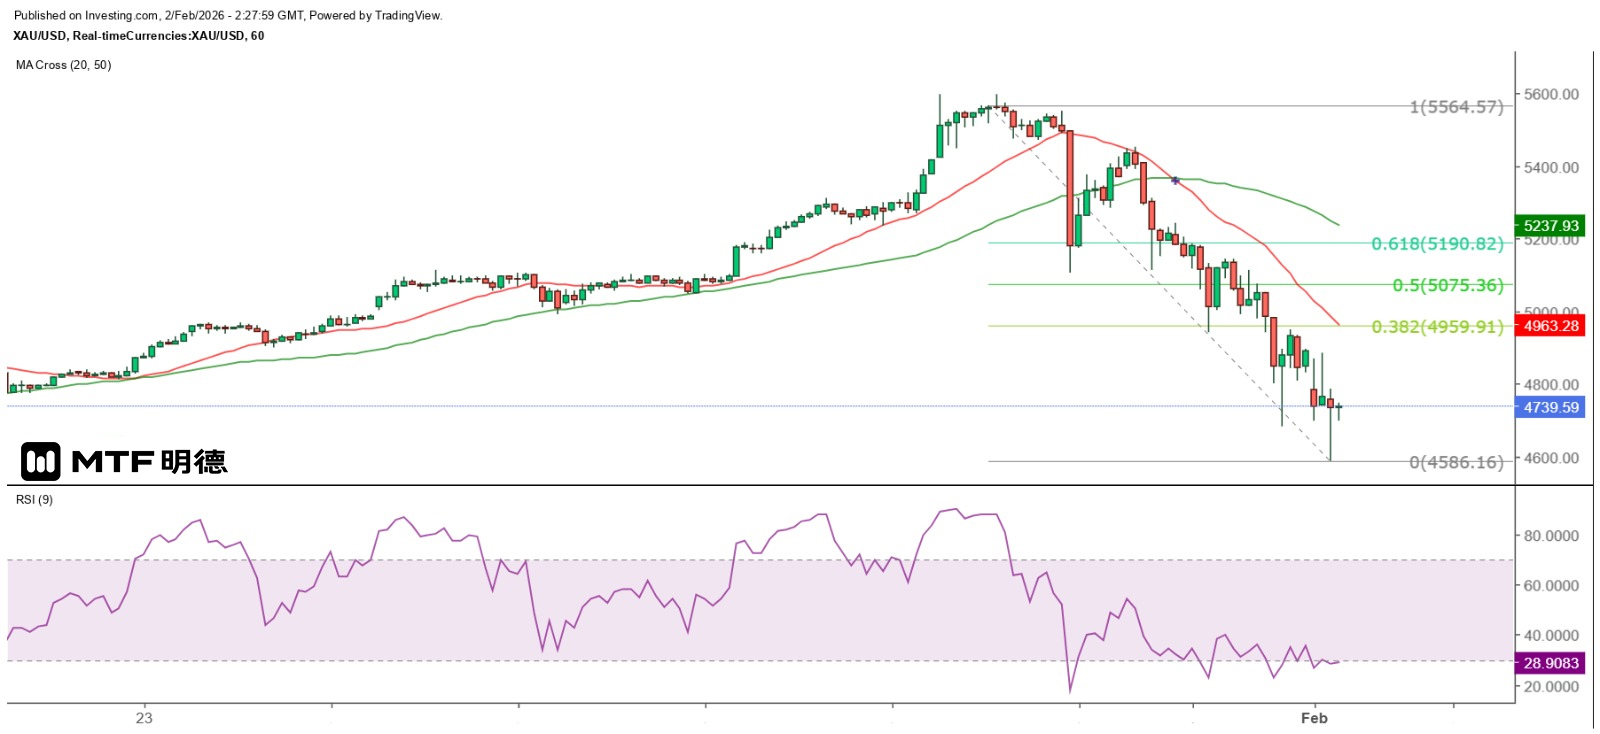
From the daily chart, the spot gold price attempted to break through the 20SMA (currently around 4786) last Friday, while the spot silver price tried to break through the 50SMA (currently around 76.15). This morning, both gold and silver opened lower with gaps and then rebounded. The gold price fully filled the gap left by the decline and then dropped again, even breaking through the low point of last Friday and testing 4600 US dollars. It bottomed out at 4586.16 US dollars before gradually rebounding and temporarily rising back above the 4700 US dollar level. As for spot silver, although it opened lower with a gap this morning and fell, it did not break through the low point of last Friday. It rebounded in tandem with the gold price. Even when the gold price was still over 100 US dollars below the low point of the gap left by the decline on the daily chart, the silver price had already turned upward. This, of course, is related to the volatility of the silver price.
At present, what investors most want to know is undoubtedly: Have gold and silver reached their peak? I can only say that there is room for a rebound, but it's hard to say that they won't fall further. Moreover, as I have pointed out, for products that use leverage and have high volatility, whether they have reached their peak (or bottom) is not that important. Not to mention using daily candlestick charts as a reference for buying and selling, even the risks generated by one-hour chart fluctuations cannot be borne.
As seen from the 5-minute chart, the gold price has yet to recover the top of the large bearish candle at $4,766, but the trend is improving. Additionally, from the Gann Square perspective, the gold price has now broken through the strong resistance level of $4,660 at the horizontal angle. The next resistance level at a 45-degree angle is $4,810, while the larger resistance is at the 90-degree angle at $4,960. Therefore, it can also be understood that $5,000 once again becomes an important resistance level for the gold price. If the gold price continues to decline, the previous high of $4,550 will be the next important support level. As for the silver price, $88 is expected to be the first major resistance for the day, while $70 is expected to be the short-term important support level.
The above content is for reference only and does not constitute investment advice.


