
 Whatsapp
 Telegram
The gold price has a significant resistance at the level of $5260 in the short term.
"Gold Price Faces Strong Resistance at $5,260 in the Short Term" 28/1/2026 10:43 Completed
Yesterday, the spot gold price reached a high of $5,101.1 at the opening of the European market and then began to consolidate. In the early New York session, it twice fell to $5,047, where it found support and then climbed again. At the end of the session, it suddenly broke through its previous high and continued to rise, pushing the gold price to a record high of $5,190.56. Although it slightly pulled back later, the upward momentum did not wane. This morning, after the Asian market opened, the gold price resumed its upward trend, reaching a new record high of $5,224.77.
In addition, non-US currencies also rose sharply. The euro reached as high as 1.2081 against the US dollar, the pound sterling reached as high as 1.3868 against the US dollar, and the US dollar fell as low as 152.10 against the Japanese yen. The market attributed the sudden weakening of the US dollar to Trump's statement that he was "not worried about the depreciation of the US dollar", which gave the market an excuse to further sell the US dollar in this turbulent global situation and the weak state of the US dollar. The sharp rise in gold prices and the breakthrough of 5200 US dollars were directly driven by the CME's decision to raise the margin requirements for silver futures contracts, while the margin requirements for gold contracts remained unchanged. This naturally led more funds that were selling or bearish on the US dollar to flow into the gold market. Currently, it can be seen that the financial market is increasingly influenced by human factors, lacking a solid foundation and tending to be irrational. This is often a sign of a bubble burst.
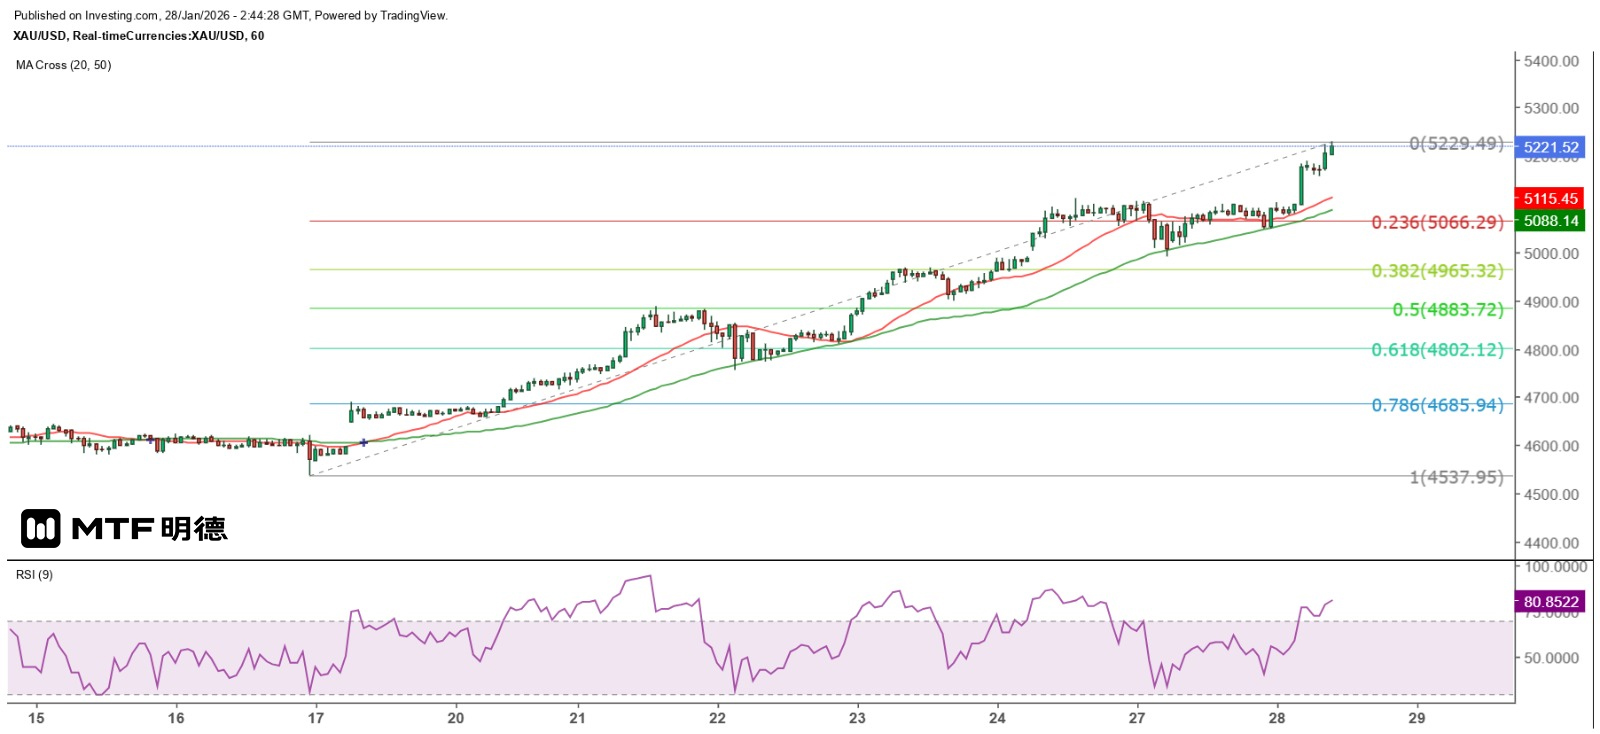
However, given the current trend of gold prices, it is expected to maintain a fluctuating upward movement in the short term. Investors should follow the trend and not merely act on the "buy" signal, as a decline in gold prices can also create considerable profit opportunities. From the perspective of the hourly chart, the previous peak of $5,111.11 has become a strong support level for short-term adjustments, with the ultra-short-term support level at $5,210. If this level is held, it is expected to further challenge $5,260, where significant resistance is anticipated. The 50SMA on the hourly chart (currently at $5,088) is a key trend indicator. Once it is breached, it indicates a reversal of the upward trend since January 16th, and gold prices are expected to undergo a deeper adjustment. Based on the current range, it is expected to find support at $4,883.72.
The above content is for reference only and does not constitute investment advice.


