
 Whatsapp
 Telegram
It remains to be confirmed whether the gold price has fallen below 4,200
"Whether Gold Price Will Fall Below 4,200 Remains to Be Confirmed" 9/12/2025 10:28 Finalized
Yesterday, the gold price remained within a narrow range. A close look at the daily chart of spot gold shows that it rose to $4,259.55 last Friday, but then dropped sharply, closing in a shooting star pattern. Yesterday, the gold price failed to break above last Friday's high, but its low was lower than last Friday's low. The price remained sideways throughout the day, with a range of about $43. This market condition is more suitable for short-term traders who take advantage of the ups and downs, but it is a disaster for those who prefer to trade in a one-way market, such as swing traders or trend followers.
Since the gold price broke through the descending triangle's lower trend line on November 28th, even though its intraday performance has been highly volatile and directionless, it has still managed to rise above $4,200. Currently, I am pondering a question: Has the gold price already fallen below $4,200? If the answer is yes, then the strategy would be to short sell when the price approaches $4,200 from the lower side, and also to take selling at higher levels as the main approach. Conversely, if I remain optimistic about the gold price's future and believe it has the potential to break through $4,200 and even reach new highs, then I would refrain from taking any action when the price approaches $4,200 from the lower side. Instead, I would buy when a buy signal is triggered above $4,200.
Since the Asian market opened today, the gold price has failed to rise above $4,200, giving a sense that it has indeed fallen below this level. However, it is also evident that the gold price has become more volatile than before. In other words, it is still uncertain whether the gold price has truly broken through the $4,200 mark. Even though the market had already factored in the possibility of a rate cut by the Federal Reserve after its interest rate decision on Thursday morning, the gold price could still experience rapid ups and downs, and only after a double-sided movement would it enter a one-way market.
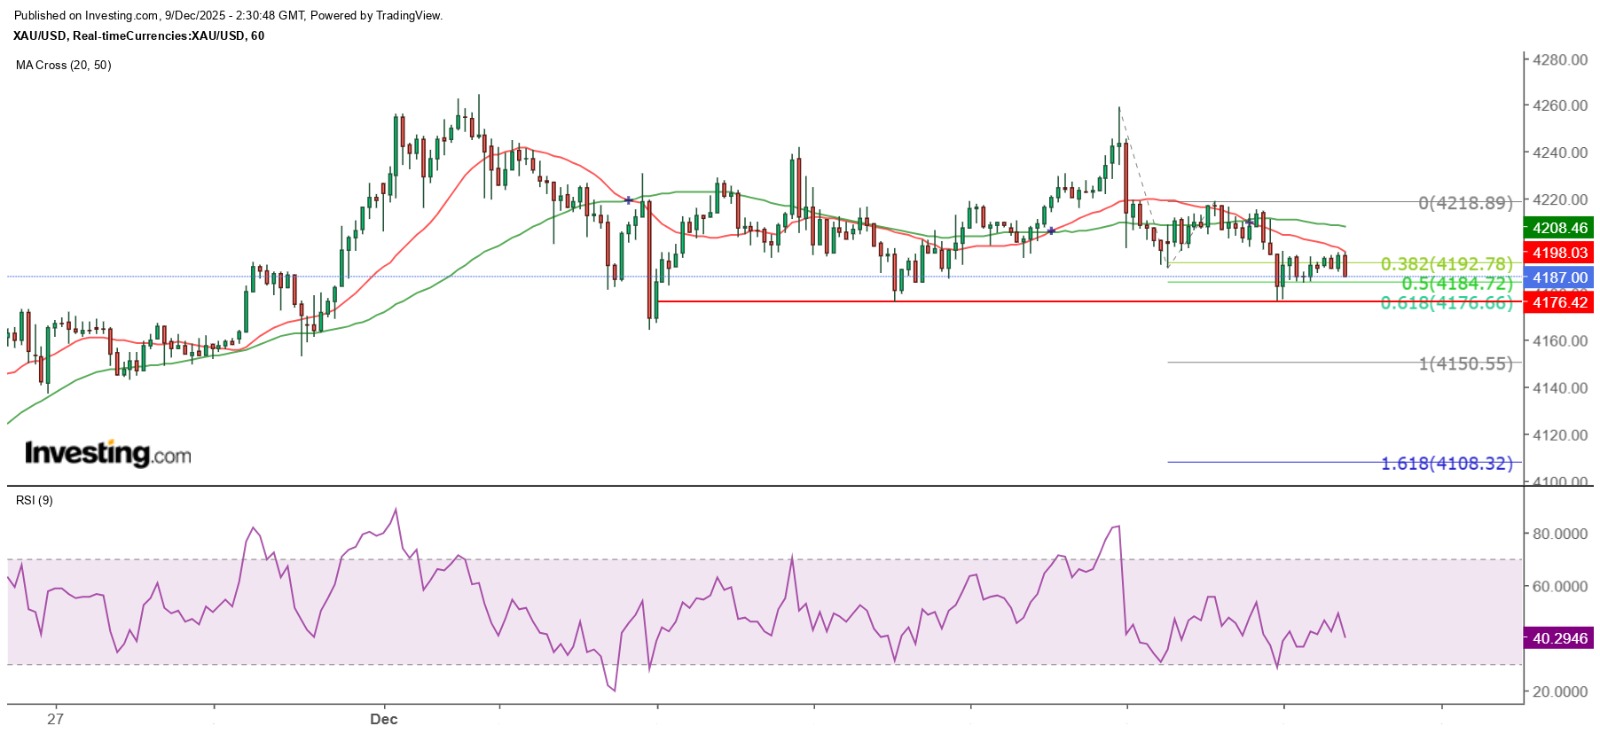
From the hourly chart, the recent pattern of each wave of gold price being lower than the previous one is quite obvious. After a sharp drop from the $4,215 level in the early part of New York yesterday, the current trend shows a descending flag formation. There is a risk that the lower end of the sideways range since last Thursday, at $4,175, could be breached. If so, the possibility of gold testing the Gann angle at $4,160 would increase significantly. Currently, the 20-day SMA on the daily chart is around $4,152, which is expected to be the first important technical support level for the recent gold price adjustment. However, if gold manages to test this level and breaks below the low of November 28th, and closes below $4,157.15, or even below the 20-day SMA for three consecutive trading days, the possibility of gold further testing $4,110 would increase!
The above content is for reference only and does not constitute investment advice.


