What does the golden cross of KD stochastic index represent?
KD indicator, also known as "random indicator", is composed of KD values and is one of the common technical analysis tools. It is often used to present the strength trend of the price, judge the relative level of the current price, and use KD to find the turning point of the price and find out the right time to enter and exit!
K value: fast average, also known as "fast line", is sensitive and fast.
D value: slow average, also known as "slow line", with slow response.
Want to use KD value to judge the price trend, looking for a turning point, can be roughly divided into the following six situations:
KD value > 80: The target is located in the overbought area, and the price performance is quite strong.
KD value < 20: The target is located in the oversold area, and the price performance is quite weak.
K value > D value: the target is in a rising market, which is suitable for partial operation.
K value < D value: the target is in a falling market, which is suitable for short operation.
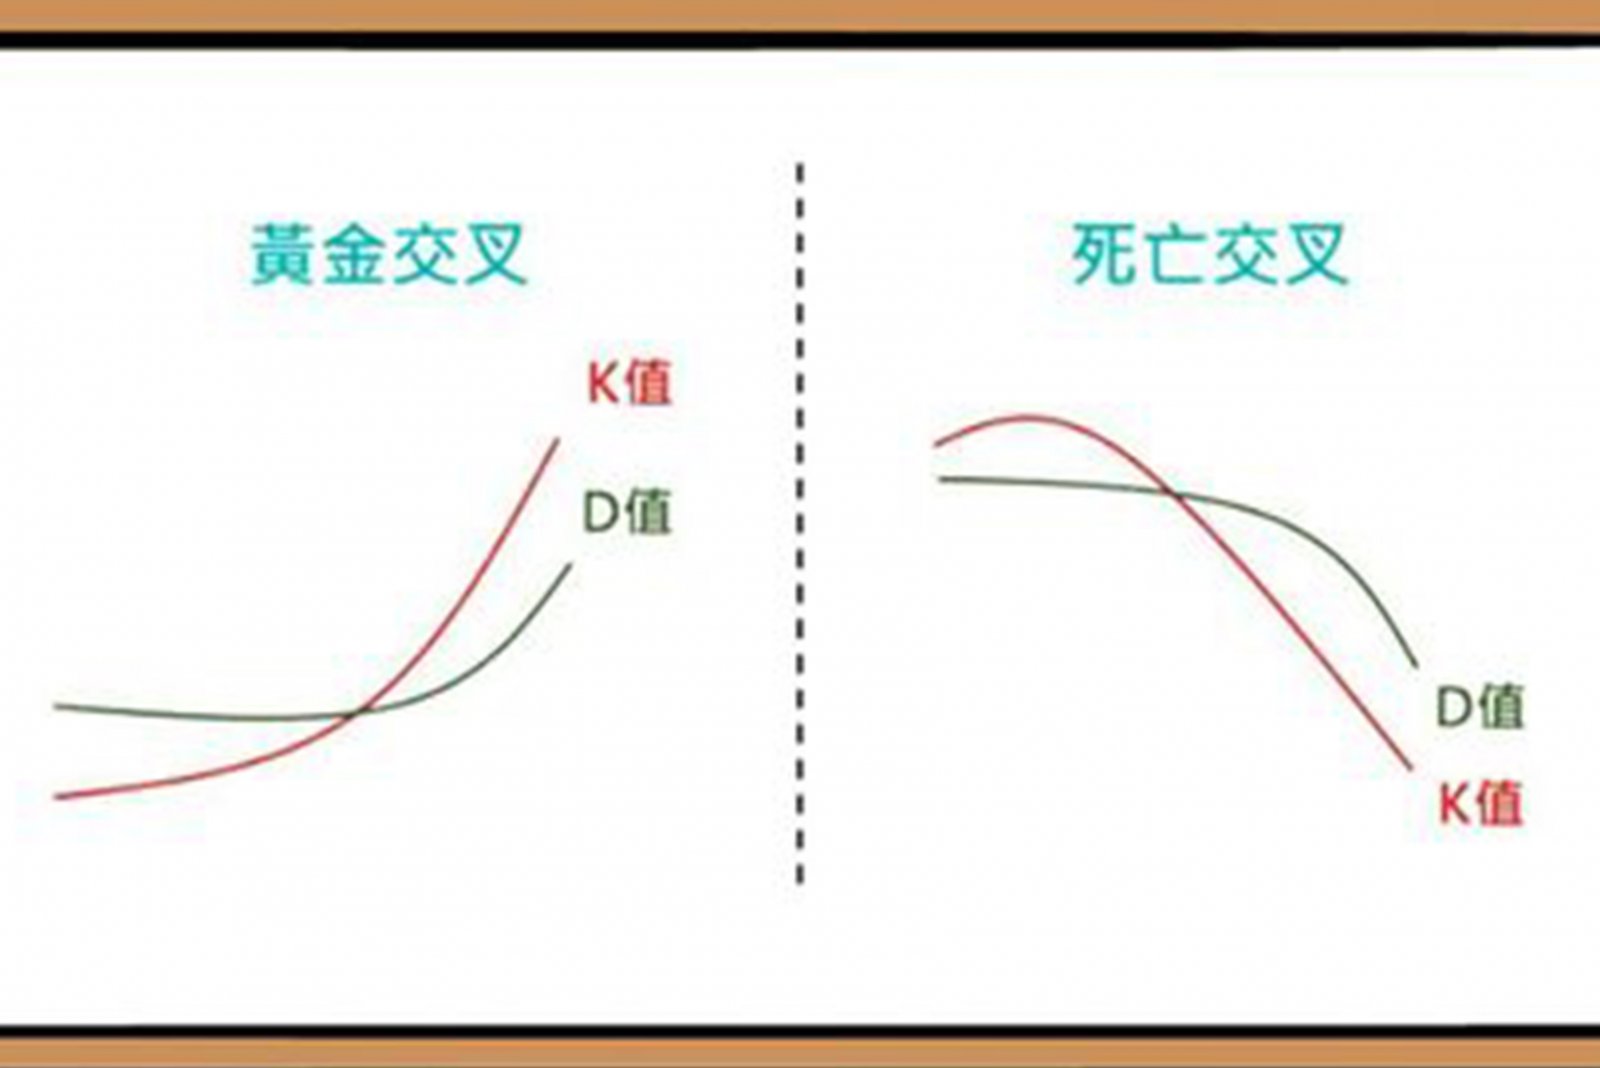
KD Golden Cross: That is, when the K value breaks through the D value from bottom to top, it is a signal that the low point begins to reverse upward, so it is advisable to buy more.
KD death cross: that is, when the k value falls below the d value from top to bottom, it is a signal that the high point begins to reverse downward, so it is appropriate to sell and go short.
KD advantage
Can quickly respond to price changes.
Compared with other technical indicators, it is simpler.
More accurate than the moving average
KD defect
Short-term variation and much noise.
Easy to operate too frequently.
Blind spots are produced during passivation.
Investors should operate KD indicators with other technical indicators or fundamentals, and should not rely entirely on a single indicator.
Previous Article Next Article


 Whatsapp
 Telegram
