
 Whatsapp
 Telegram
 2026-08-10
 The 50-day moving average of the gold price serves as a strong medium-term support level.
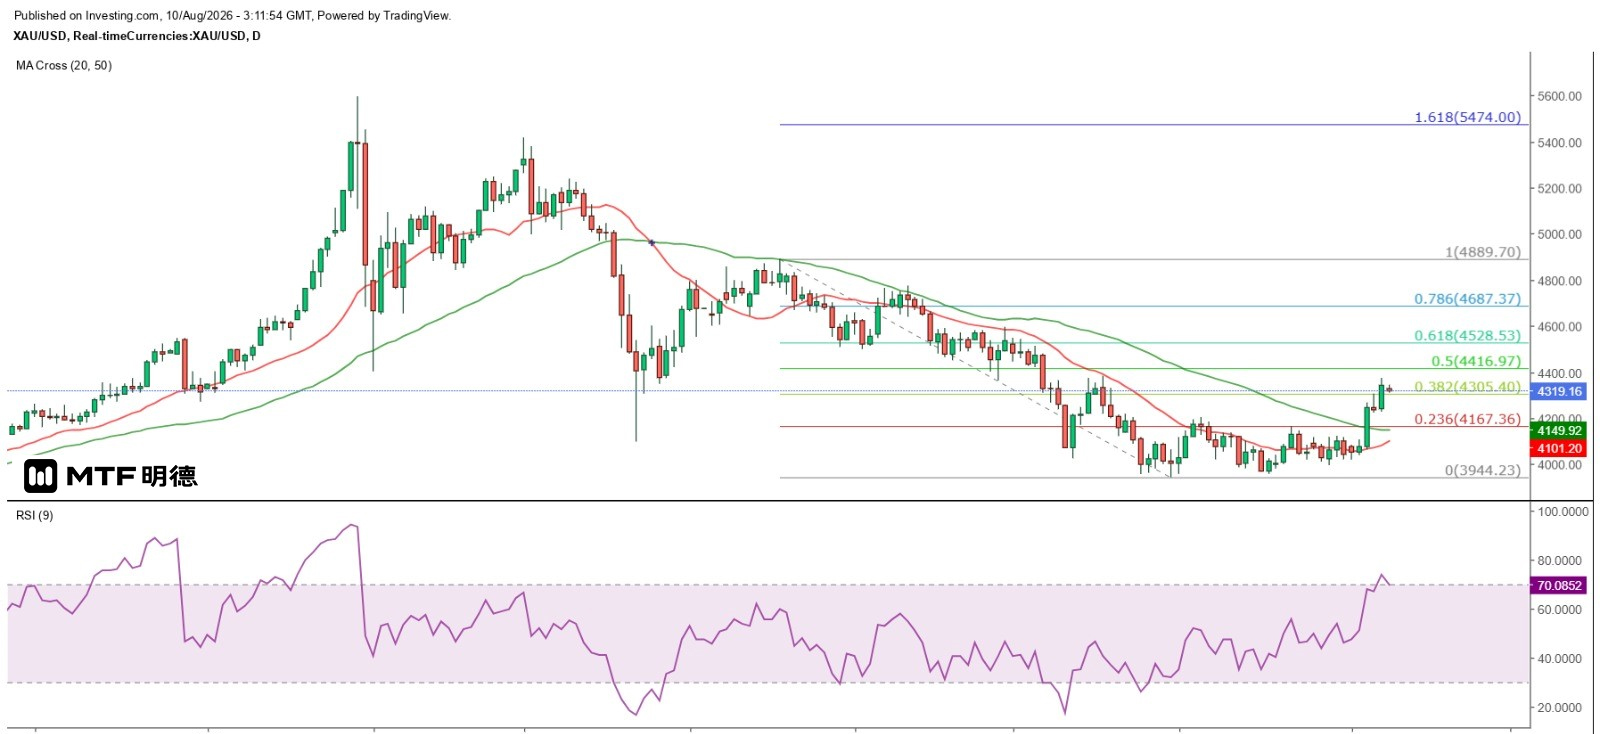
"50-Day Moving Average of Gold Price Provides Strong Medium-Term Support"
Completed on October 8, 2026, at 11:10 AM
Last Friday's U.S. July employment data came as a disappointment. Nonfarm payrolls fell by 23,000, sharply diverging from the market's expectation of an increase of 88,000. This marked the second consecutive month of job losses this year, following a downward revision in June’s job gains—from 57,000 to just 20,000. Additionally, private-sector job growth added only 30,000 positions, well below the expected 78,000. As a result, the overall decline in employment was driven by government sector cuts of 53,000 jobs—the fourth consecutive month of reductions in public-sector employment.
Although the unemployment rate dropped by 0.1 percentage point to 4.1%, the unexpected decline in nonfarm payrolls left markets deeply disappointed. The drop in jobs was unforeseen and thus not previously priced in, triggering significant volatility across financial assets. Investors who had been bullish on the dollar naturally cut their positions to manage risk, while traders who had held back before the release seized the opportunity to sell aggressively. Consequently, the U.S. dollar plummeted, gold prices surged, and U.S. equities rallied sharply.
However, based on personal experience, the short-term market impact of U.S. employment data—whether strong or weak—is typically absorbed within half an hour. Indeed, after the spot gold price jumped from $4,309 to $4,371.89, it began to retreat, reaching its intraday high just 15 minutes after the data release, followed by a gradual pullback. In New York afternoon trading, prices traded sideways above $4,327. The dollar did not collapse significantly, which I believe is due to two main factors: first, the nonfarm payroll change exceeded expectations by over 100,000, possibly influenced by special circumstances; second, although government jobs declined, private-sector employment still increased. Moreover, markets will now closely watch the Federal Reserve’s stance—whether it shifts focus from inflation to the labor market, or continues prioritizing inflation control.
From a technical perspective, examining the daily chart, last Friday’s sharp rise in gold reversed more than 38.2% of the decline since April 17, bringing prices closer to the 50% retracement level at $4,416.97, which acts as a major resistance zone. From Gann Square analysis, $4,410 lies at the 270-degree vertical angle, making it highly likely that gold will face strong resistance between $4,410 and $4,416, potentially triggering another substantial pullback. Nevertheless, gold has clearly broken above the 50-day SMA (at $4,150), indicating a clear medium-term upward trend. This moving average will now serve as a robust support level during any short-term correction. Therefore, traders should consider selling gold around $4,410–$4,416, while buying near the 50-day SMA. More advanced traders may engage in high-selling and low-buying strategies between these levels, but overall, a strategy of buying on dips remains advisable.
The above information is for reference only and does not constitute investment advice.


