
 Whatsapp
 Telegram
The price of gold is likely to test the level of $4010 in the short term.
Gold price may test $4,010 in the short term
November 6, 2026, 11:08 AM
Yesterday, the U.S. released its latest inflation data, showing that year-on-year headline CPI rose 4.2% in May—meeting market expectations but accelerating from April's 3.8%, marking the largest increase since April 2023 and extending gains for the third consecutive month. Overall energy prices surged 23.5%, up from 17.9% in April, with gasoline prices rising sharply by 40.5% and petroleum fuel prices jumping even more, up 58.9%. Core CPI showed relatively modest changes, with the year-on-year increase widening by 0.1 percentage point to 2.9%, while the month-on-month rise slowed from 0.6% to 0.5%.
After the data release, gold prices surged sharply, with spot gold rising from $4,140 to $4,173 before gradually retreating and dropping as low as $4,133. On the 5-minute chart, gold formed a small double bottom at the pre-data low of $4,131, then resumed its upward move, peaking at $4,186. Subsequently, it entered another downward wave, testing below $4,024 this morning before launching a strong rebound, reaching a high of $4,118. However, it later declined sharply again and currently stabilizes around the $4,050 level.
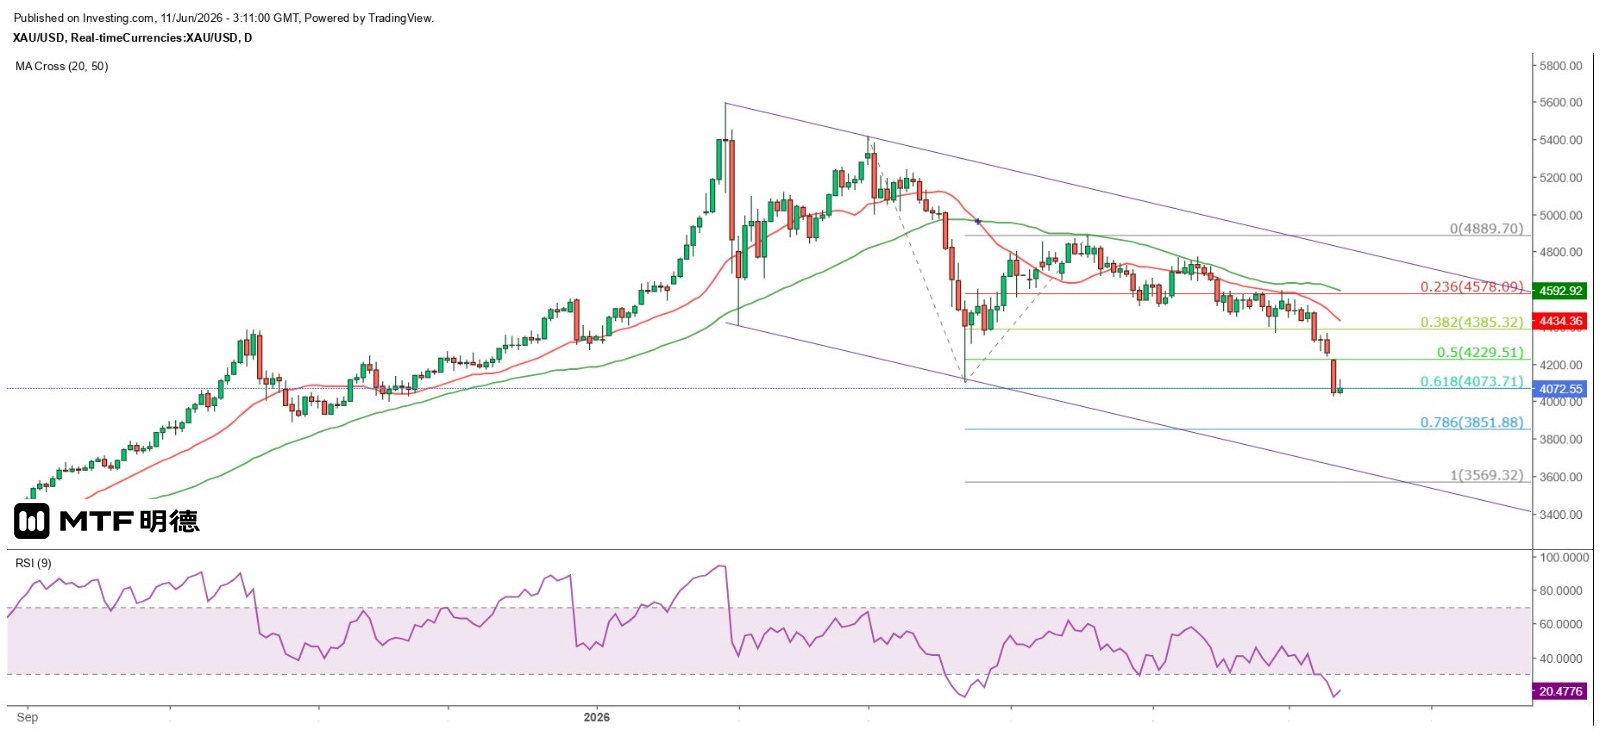
On the hourly chart, spot gold prices broke below the 50SMA (currently around 4218) last Friday. On Tuesday this week, they briefly rose above this level but ultimately reversed with a bearish engulfing pattern, falling back below it and continuing to decline along the 20SMA (currently around 4123), failing to reclaim this line so far. Additionally, gold has dropped below the March 23 low of $4099.5. Currently, the daily RSI has fallen below 20, indicating an extremely oversold condition, which may form a large double bottom with the March 23 low.
However, gold prices have performed worse than expected. Currently, the daily candlestick chart shows no buying signals. If the price continues to move downward along the broader descending channel and reaches the 100% Fibonacci extension level, it could drop to $3,569.32. The Gann 135-degree angle at $4,110 has already been breached, and in the short term, the market may test the key support level of the 90-degree angle at $4,010. The recent price movement appears familiar, only this time contrary to the previous strong upward trend. Investors who remain bullish on gold's long-term outlook should adjust their mindset promptly.
The above information is for reference only and does not constitute investment advice.


