
 Whatsapp
 Telegram
The gold price is expected to launch a strong rebound wave.
Gold Price Poised for Strong Rebound Wave
Completed on 2/6/2026 at 11:06
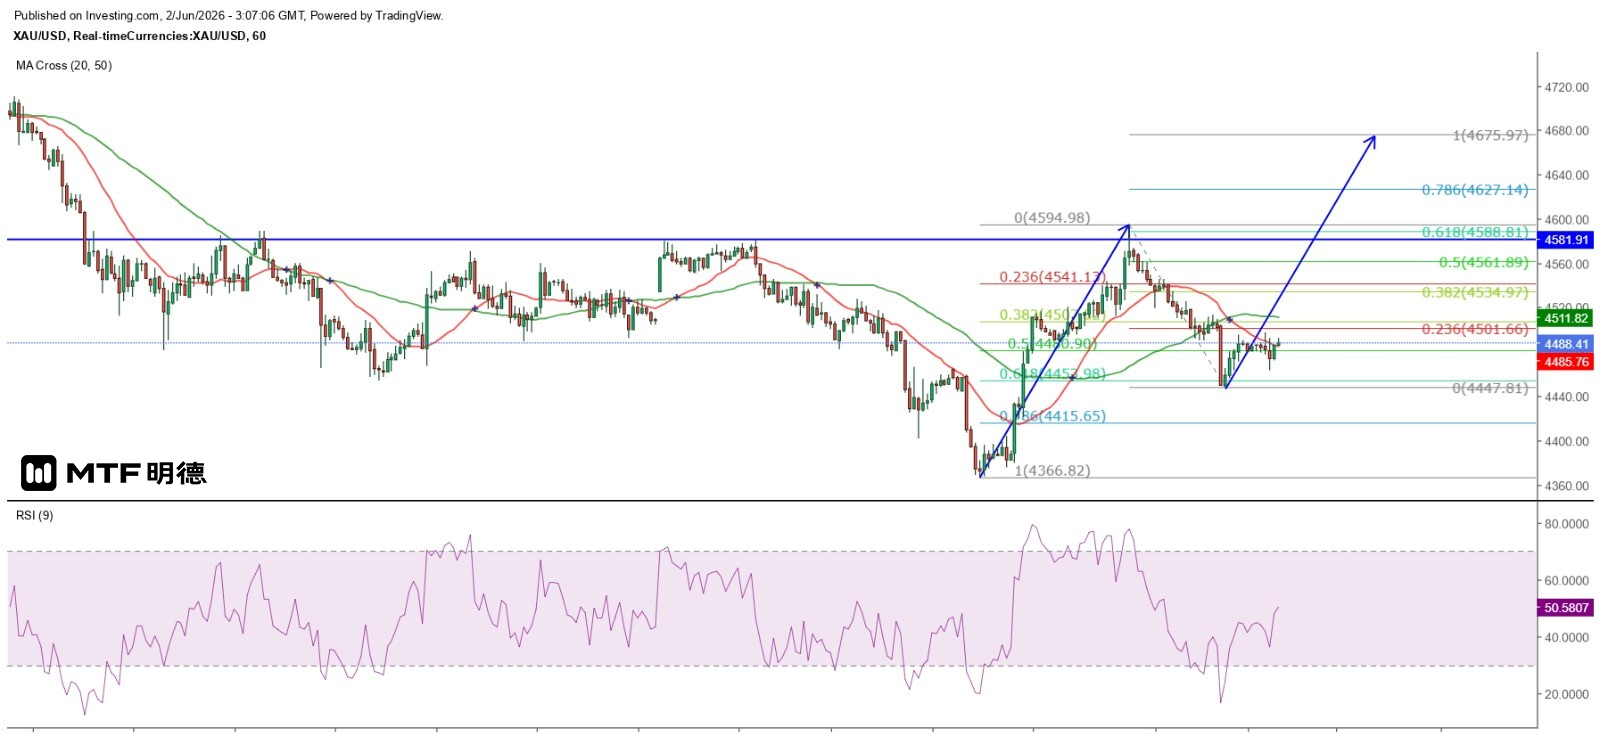
Yesterday, gold prices continued to decline as expected, with the correction reaching a level equivalent to 61.8% of the gain since last Thursday—the maximum extent I am willing to tolerate. Once this threshold is exceeded, it would be time to reconsider the trading direction. On the hourly chart, spot gold fell below the 20-period SMA (currently around 4486) during early Tokyo trading and continued downward, plunging sharply to $4,449 by early New York session. It later dipped further to $4,447.8 before rebounding. However, after briefly hitting a high of $4,497.2 this morning, prices declined again, clearly showing technical resistance near the 20-period SMA.
The sharp drop in gold prices is likely linked to reports that Iran has halted communications with the United States, apparently due to Iranian dissatisfaction over Israel's continued attacks on Lebanon. However, Trump stated he has urged both sides not to fire and expressed confidence that an agreement with Iran will be reached next week to extend the ceasefire and reopen the Strait of Hormuz. Nevertheless, markets have long lost patience with this game of postponing decisions day after day; unless both sides officially announce a deal, oil and gold prices are expected to remain volatile in the short term.
In the short term, the large bearish candlestick formed on the hourly chart last night, peaking at $4,503.9, will act as the first resistance level for a potential rebound. The subsequent resistance lies at the Gann 33.5-degree angle of $3,510, followed by further resistance at $4,580, with the strongest resistance still remaining at $4,660. Given that yesterday's correction exceeded 61.8%, it is sufficient to trigger a stronger rebound wave. If gold reaches the Fibonacci extension level of 100%, it could climb close to $4,676. However, a slight breakout above the strong resistance at $4,660 may trigger another significant pullback. Nonetheless, the overall strategy remains focused on buying low, with stop-loss placed below $4,450 on the hourly chart, before entering new positions.
The above information is for reference only and does not constitute investment advice.


