
 Whatsapp
 Telegram
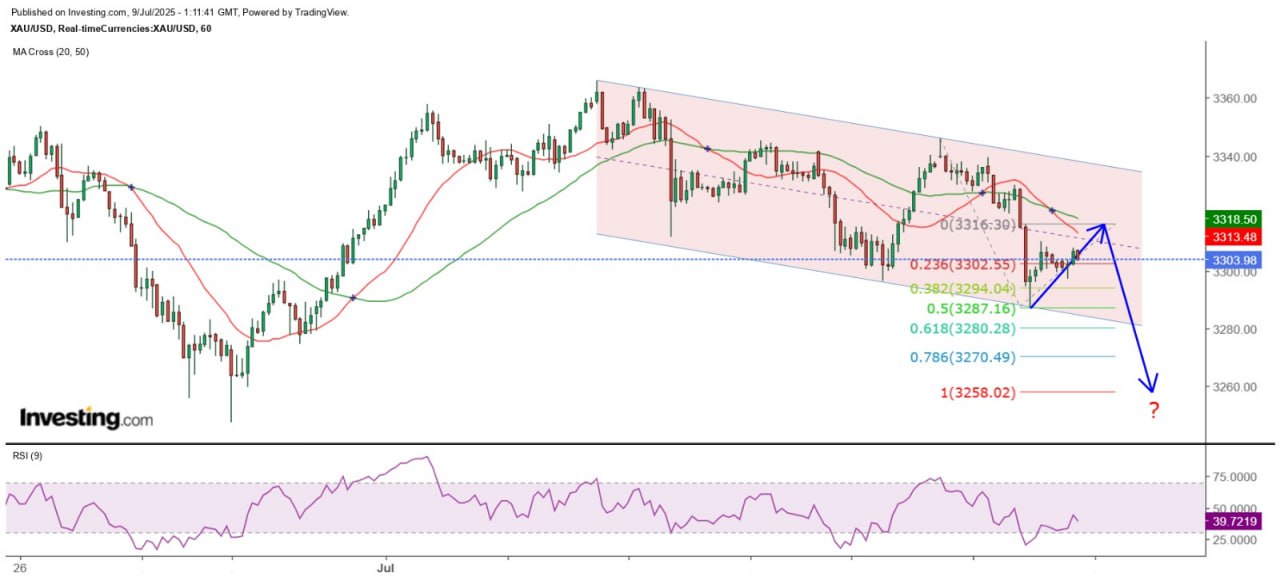
The gold price has shown a short-term downward channel pattern
"Gold Price Short-Term Trend Shows a Descending Channel Pattern" 9/7 9:37 am Completed
US President Trump announced that the final implementation date for reciprocal tariffs would be set on August 1st, and emphasized that there would be no further extension. As the original "deadline" of July 9th was pushed back, it reflects that Trump still hopes to reach trade agreements with his trading partners, or that so far, few countries have reached trade agreements with the US, forcing him to extend the negotiation period. Therefore, only Trump knows whether August 1st is truly the "deadline".
Global money supply continues to reach new highs.
At present, investors may be concerned that if reciprocal tariffs lead to a sharp rise in US inflation, the Federal Reserve cannot cut interest rates, which would be unfavorable for gold. But isn't gold traditionally an inflation hedge? Why is its performance so weak now? This can be attributed to both long-term and short-term factors. The long-term factor is related to the money supply. The Federal Reserve began raising interest rates in March 2022 and ended in July 2023. It started cutting interest rates in September last year and slowed down the pace of balance sheet reduction. The M2 money supply of the world's four major central banks (the United States, Europe, Japan, and China) reached a record high of nearly 93.7 trillion US dollars in May, indicating that the previous interest rate hike cycle did not reduce the balance sheet at the same pace.
In the short term, the military conflict between Iran and Iraq and Trump's reciprocal tariff measures have supported the further rise of gold prices. However, the geopolitical crisis in the Middle East caused by the Iran-Iraq conflict has been rapidly resolved (although the Middle East remains a powder keg in the foreseeable future), and countries are striving to reach trade agreements with the United States. The cumulative increase in gold prices this year has reached 33% for spot gold and 22% for August gold futures. It is not just an inflation hedge but has far outpaced inflation. However, in an increasingly uncertain global political and economic situation, gold, which has no productive capacity, will naturally become a cash-out tool. The recent new highs of the S&P 500 and Nasdaq indices reflect that the negative impact of reciprocal tariffs on the global economy may not be as severe as expected.
The market outlook is gloomy after the 50-day moving average was lost.
In terms of the trend, the gold price rebounded to a high of $3,451.6 on June 16th and then presented a double-day reversal pattern, erasing all gains from the previous day. This was the first strong signal of a downturn in the recent period. The subsequent movement was volatile and downward, with a single-day reversal and a bearish engulfing candlestick pattern. After breaking below the 20-day SMA ($3,846.7) on June 24th, it only closed above this line on July 2nd. Recently, it has remained above the 50-day SMA for five consecutive trading days, but lost this position yesterday. Yesterday, the spot gold price closed below the 50-day SMA ($3,321.7) in a bearish engulfing pattern and briefly fell below the psychological level of $3,300. The outlook remains bearish. In the short term, the gold price has been in a downward channel since July 2nd. It is expected that $3,316 and $3,330 will be the main resistance levels in the immediate term. It is not ruled out that it will test $3,267 or even $3,258 before rebounding within the day.
The above content is for reference only and does not constitute investment advice.
MTF Special Analyst Zheng Guangfu


