
 Whatsapp
 Telegram
 2026-07-14
 Gold prices are expected to fluctuate around $4,000.
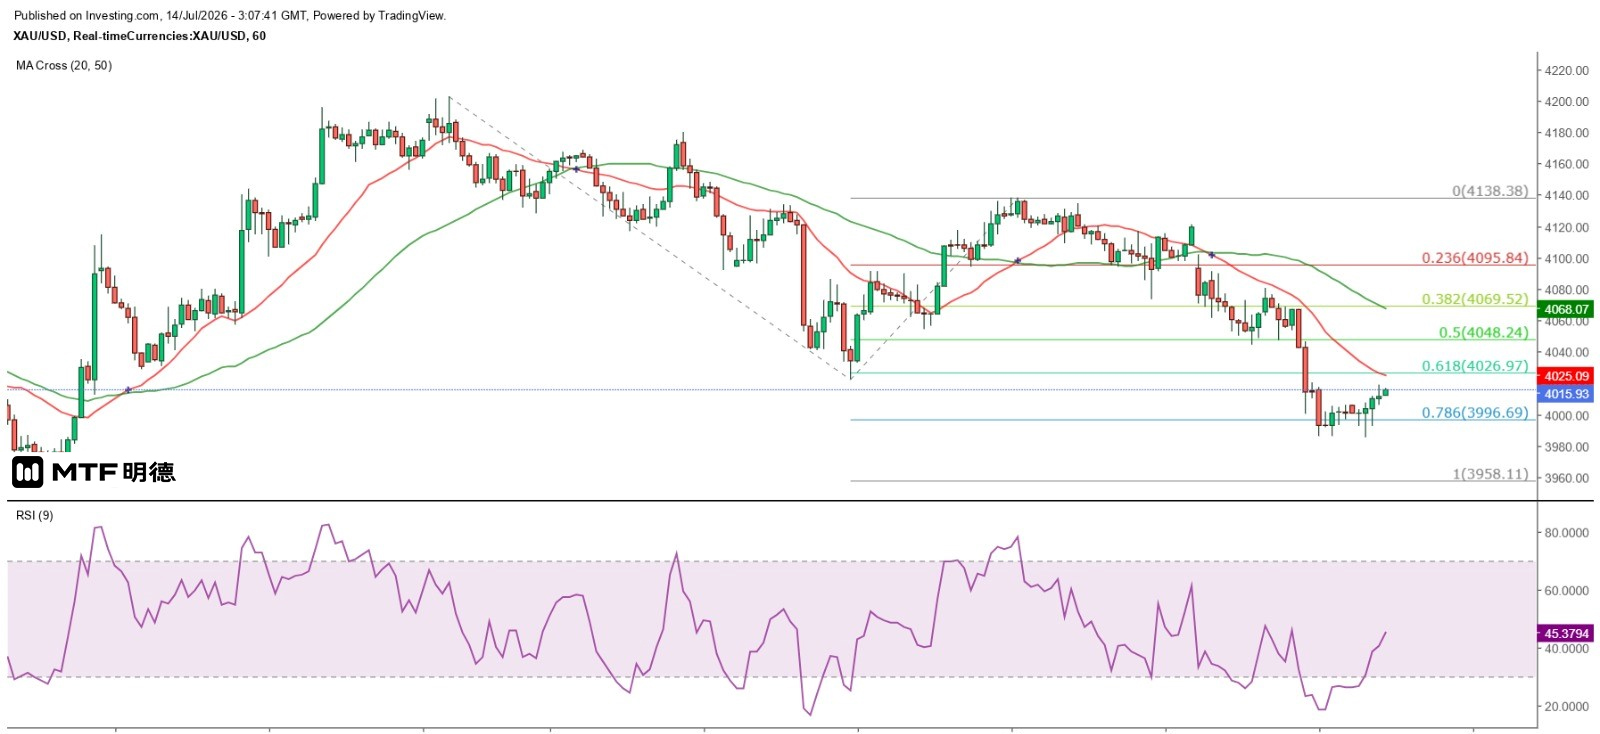
Gold prices are expected to fluctuate around the $4,000 level.
July 14, 2026, 11:07 AM – Finalized
Gold's performance has largely met expectations. Although spot gold dipped below the July 8 low of $4,022 and even tested the psychological $4,000 level, it did not see a further sharp decline. After hitting a low of $3,986.71 at London's close yesterday, prices stabilized immediately, and bearish momentum failed to gain traction in New York trading. Although gold briefly fell to $3,985.76 during early Asian trading today—testing yesterday’s low—the hourly chart shows that prices ultimately reversed course within an hour, rising back above $4,000.
Measuring the hourly chart's movement since July 6 using Fibonacci extension levels, gold has already declined by slightly more than 78.6% from its peak on July 10. If the decline reaches 100%, gold could fall to $3,958.11. On the hourly chart, gold's rebound since yesterday has been capped by the 20SMA at 4,027, suggesting that as expected, a recovery wave may not occur until this Thursday.
Since $4,010 lies at the 90-degree angle of Gann's square, it serves as a key support (or resistance) level for gold prices. A break below this level is expected to intensify the downward trend. Tonight, Federal Reserve Chair Wash will testify before the House committee, and the U.S. Department of Labor will release June's CPI data today. Gold prices are likely to fluctuate around the $4,000 level. However, if prices drop near $3,958.11, bearish positions should consider taking profits. This is because the decline has already reached a 100% Fibonacci extension, and the price is approaching the lowest point since the peak in January—$3,944.23. A break below that level would create a triple bottom divergence between the daily chart and the 9RSI, potentially triggering a stronger rebound in the future.
The above content is for reference only and does not constitute investment advice.


