


 Whatsapp
 Telegram
The gold price has dropped by 4,000 and the downward trend has not yet ended
"Gold Price Falls Below 4,000, Downward Trend Continues" 5/11/2025 10:05 Completed
Needless to say, everyone has witnessed the sharp drop in gold prices in the first half of the trading session in New York yesterday. Spot gold hit a low of $3,928.96, and then rebounded continuously. It rose to a high of $3,975.52 after the London market closed, but then fell again. This morning, in the early trading session in Tokyo, it dropped to a low of $3,930.23 and rebounded again, but was temporarily constrained by the psychological level of $3,950. However, the fluctuation range of gold prices has shifted down to between $3,960 and $3,910.
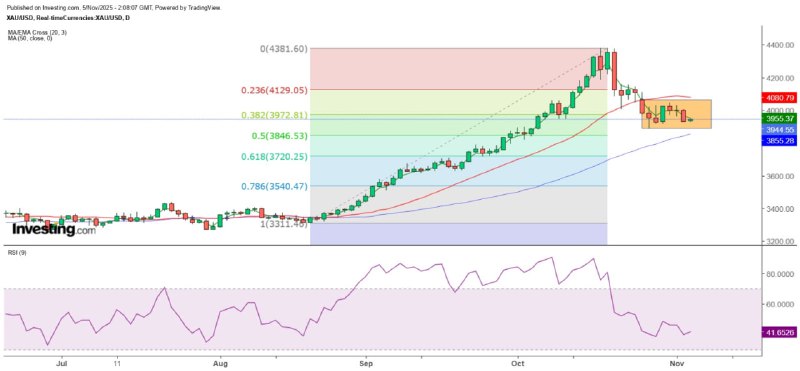
After rebounding over 45 dollars from the day's low yesterday, gold lost almost all of its gains within a few hours, and the high was only about 25 dollars away from the 4000-dollar mark. This suggests that the 4000-dollar level has been breached, and it is unlikely that gold will return to this level within the year. The logic is simple: when you see gold no longer making new highs and instead retreating step by step, breaking through the 20-day SMA (4080.8) is a strong bearish signal. Investors become more vigilant, and as gold continues to fall and they must take action, the selling pressure on gold will only increase. Some investors may think that the sudden drop in gold is a shakeout or washout, but the rally in gold did not just start. It began as recently as September this year and as far back as October 2023. How long will the big players need to wash out before it's over?
The $3,900 level is expected to be breached again within the day.
Yesterday, I pointed out that the gold price breaking through the 4,000 mark in the early Asian market was not a good sign, and it also provided an answer to the question of whether it was a signal that the gold price was about to fall sharply again. Currently, the gold price is at its most vulnerable point, and it is highly likely to fall below 3,900 US dollars today. This level was breached on October 28th, when it dropped to a low of 3,886.66 US dollars before rebounding. What investors need to pay attention to now is the trend on the daily chart.
$3,500 is unlikely to be the adjustment low point.
After gold prices broke through the 20-day SMA on October 27th, they have gradually formed a sideways consolidation pattern. Currently, they are close to the bottom. Using a simple measurement method, gold prices could fall to the $3,700 level. The $3,720.25 mark represents the 61.8% retracement target of the largest increase since August 20th and may offer temporary support. The previously mentioned $3,500 is unlikely to be the ultimate adjustment low for gold prices. If the 2023 increase since October is adjusted by 50%, gold prices would fall to $3,050.85. Therefore, it is expected that only $3,000 can provide significant support for gold prices. Additionally, as we enter November, the 9RSI on the monthly chart of gold prices has dropped from 94 to 89, but it still remains in a severely overbought state. The adjustment in gold prices has not yet ended. Manage risks well!
The above content is for reference only and does not constitute investment advice.
MTF Special Analyst Zheng Guangfu
Previous Article Next Article


