


 Whatsapp
 Telegram
Gold prices rebounded before breaking through 4,000
"Last Bounce Before Gold Price Breaks Through 4000" 27/10/2025 9:57 Completed
Last week, the US released its September CPI, which rose by 3% year-on-year, slightly lower than the expected 3.1%, but still 0.1 percentage point higher than that of August. It was the first time since January this year that it exceeded 3%. Whether this indicates a warning sign of rising inflation remains to be seen. However, the data is believed to make the Federal Reserve more cautious in its judgment of the inflation outlook. Even if it still leans towards a 25 basis point rate cut after this week's interest rate meeting, it is believed to remain highly vigilant about inflation. It is just that the impact of tariffs on inflation has not been obvious yet, so the Federal Reserve has shifted its focus to the weak job market.
After the release of the US September CPI data, the gold price immediately rose by more than 30 dollars from a low to 4092.81 dollars, then fluctuated and rose to approach 4134.92 dollars but was blocked and gradually pulled back. After the London market closed, it slightly rose to 4138.52 dollars but was blocked again. Subsequently, it formed a double top pattern and finally closed above 4110 dollars. However, during the holiday, it was reported that the US and China had reached a preliminary framework agreement on trade. The gold price opened nearly 40 dollars lower in today's Asian market, falling to a minimum of 4058.61 dollars. It then continued to rebound but was still constrained by 4100 dollars.
Beware of gold price decline after interest rate decision
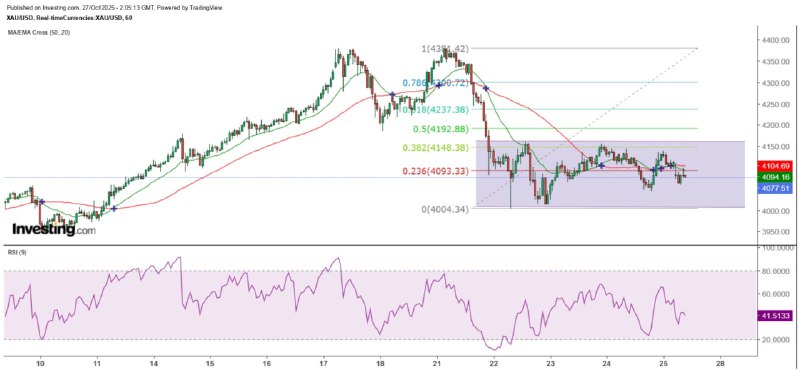
From the hourly chart, the gold price has returned to the sideways range since last Thursday and is fluctuating within the Gann angle between $4,060 and $4,110. Last week, it was pointed out that today is the reversal day for the gold price. This morning, the gold price continued the downward trend from last week. If it closes with a bearish candlestick, the meaning of the "reversal day" will be clearly indicated, and the gold price is likely to start a sustained rise from tomorrow. The reason is that the market expects the Federal Reserve to cut interest rates after the interest rate decision on Thursday morning. However, the rate cut is already within market expectations, so the gold price may fall again after the announcement of the interest rate decision.
Since the gold price plunged sharply on October 21 and broke through the neckline of the double top on the hourly chart, the highest rebound so far has only reached $4,161.39, still $25 short of the neckline at $4,186.4. Even if the gold price touches or breaks through this level this week, given the current trend, it is unlikely to break through. This week, the gold price is likely to fall below the last rebound before it dropped below $4,000. From the trend analysis, after the sharp drop, the gold price has been moving sideways, which is a typical consolidation and break pattern (the sideways consolidation after a sharp drop indicates a higher probability of a downward break).
The 20-day moving average of gold prices must not be lost.
As seen from the daily chart, after gold prices broke through the 20-day SMA (currently around 3772) last Wednesday, although they eventually closed above this line, there has been no significant rebound to break free from its pull. Last Friday, prices even briefly fell below this line. Therefore, it is important to pay close attention. If gold prices close below the 20-day SMA, there is a high possibility of further decline, and conservatively, it could fall to 3510 US dollars. For today, 4060 US dollars is a key support level. If this level is breached, gold prices will test 4010 US dollars. Conversely, if they break above 4110 US dollars, the likelihood of challenging 4186 US dollars increases.
The above content is for reference only and does not constitute investment advice.
MTF Special Analyst Zheng Guangfu
Previous Article Next Article


