


 Whatsapp
 Telegram
The short-term gold price has formed a triangular pattern waiting to break
"Gold Price Short-Term Triangle Pattern Awaits Breakthrough" 4/11/2025 9:54 Completed
Over the past two trading days, the volatility of gold prices has significantly narrowed. From the daily chart perspective, a short-term ascending flag pattern seems to be forming. However, gold prices remain below the 20-day SMA (currently around 4088), and the weekly chart shows that the bullish and bearish candles have given a bearish signal. Even though gold prices have repeatedly returned above the $4,000 mark, they can easily fall back below it.
Gold prices fell below $4,000 near the London midday session yesterday, but rebounded after hitting a low of $3,993. They rose to a high of $4,030.59 before the London close, but then dropped again and fell below $4,000 once more, reaching a low of $3,995.59 before stabilizing. In the last hour before the New York close, they rose to $4,014.94, but then fell again, closing slightly below $4,002, which was essentially unchanged from the previous Friday's closing price.
The Asian morning market's crossing of 4,000 points is not a good omen.
This morning, gold prices plunged to $3,984.43 in the early Asian session before rebounding, but failed to reach $4,000. Subsequently, they fluctuated and declined. From the 5-minute chart, it is evident that gold prices are constrained by the 20SMA (currently around $3,990). I feel that yesterday's sharp drop was a prelude, and the range was only slightly more than $32. If this reflects that gold prices are seeking a direction to break through, the possibility of a downward development is relatively high. The recent significant fluctuations in gold prices have led some speculators to believe that it is a "washout". If this is true, the market is also likely to decline in the future. Judging from the timing of the gold price changes, today marks the first time since October that gold prices have fallen below $4,000 in the early Asian session. Last Friday, they dropped below that level during the midday Tokyo session. Could this be a signal that gold prices are about to fall sharply again?
The short-term support level of $3,960 must not be lost.
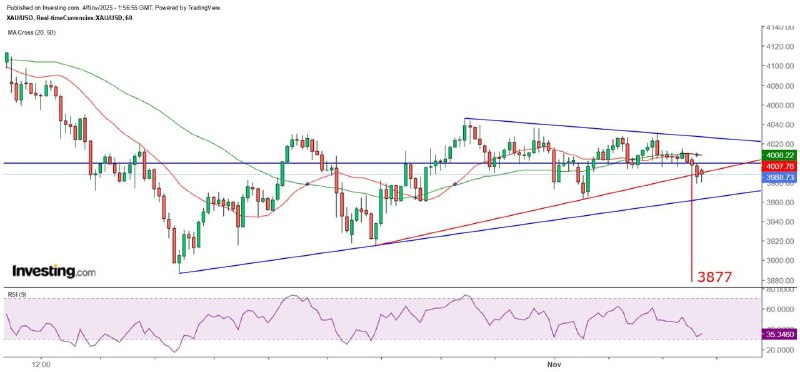
From the hourly chart, it can be seen that the gold price has formed a narrowing triangle since October 28th, indicating that the gold price is in a breakout pattern. Moreover, the gold price has broken through the TD ascending trend line, and the measured decline target is approximately $3,877. If the gold price fails to rise above $4,000 today, this level is likely to become a short- to medium-term resistance. In this case, the current gold price of $3,990 can be regarded as approaching the top. Analyzed by Gann angles, the current gold price is below $4,010, meaning the fluctuation range has dropped to $4,010 to $3,960. Therefore, $3,960 is a key support level. If it is breached, the secondary support level of $3,910 will be tested.
The above content is for reference only and does not constitute investment advice.
MTF Special Analyst Zheng Guangfu
Previous Article Next Article


