


 Whatsapp
 Telegram
The gold price is approaching its short-term peak
"Gold Price Approaches Short-Term Phase Top" 31/10/2025 9:42 Completed
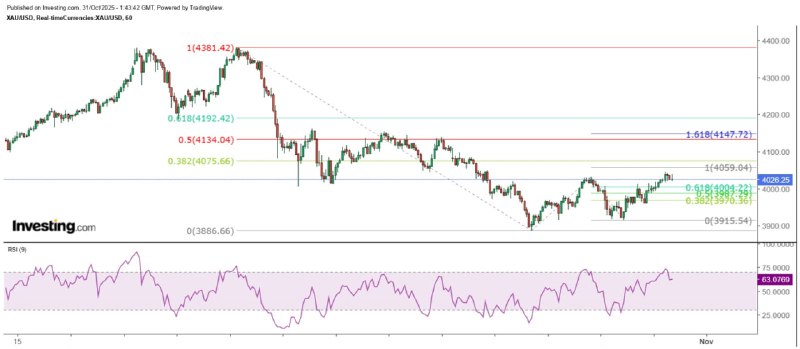
Today marks the last trading day of October. As previously mentioned, every time the gold price breaks through the $1,000 mark, it tends to fall back below it in the following month. Now, the $4,000 level was breached this month, meaning that the price is likely to fall back below $4,000 in November (whether it will rise again is another matter). From a daily chart perspective, yesterday's rebound was the strongest since the gold price started to decline from its historical high. If the gold price can hold above the significant Gann angle at $4,010, it may challenge the secondary resistance at $4,060 in the short term. After that, the 20-day SMA at $4,088 comes into play. Only if it can stay above this line will the chances of further increase in the gold price increase.
There is strong resistance at $4,060.
However, from the hourly chart, it can be seen that $4,088 is merely the 38.2% retracement level after the biggest decline since the historical high. Looking ahead, there are more significant 50% and 61.8% retracement resistance levels at $4,075.66 and $4,192.42 respectively. I still believe that the resistance at the previous double top neckline, $4,186, remains strong. In the short term, as expected, gold reversed upward on Monday this week and has since shown a balanced upward channel pattern. Measured by Fibonacci extension levels, the high of $4,046.21 reached this morning is about $13 away from the 100% extension level of $4,059.04, which is just below the Gann angle at $4,060. In other words, gold is now approaching a phase top and could fall sharply again at any time.
The intraday decline target is $3,970.
In the short term, gold prices remain in an upward trend that began after breaking through in the early morning of New York yesterday. However, it should be noted that if the gold price closes below $4,016.33 on the hourly chart, it would be a signal of a downturn. Aggressive traders may consider a break below the important Gann angle at $4,010 or even a fall below $4,000 (the 20-hour SMA is currently around $3,999.6) as a sign of a downturn. As of this morning, more than an hour after the opening of the Tokyo market, the gold price has not yet broken through the early Asian market high of $4,046.21. On the 5-minute chart, it shows a narrowing triangle, and the gold price has twice fallen to the $4,019 level. The possibility of a downward break seems greater, and it may target the 38.2% and 50% retracement of the largest increase since yesterday's low of $3,919.54, which means the short-term downward targets for the gold price are $3,987.29 and $3,970.36 respectively.
The above content is for reference only and does not constitute investment advice.
MTF Special Analyst Zheng Guangfu
Previous Article Next Article


