


 Whatsapp
 Telegram
Gold prices are expected to rise back above $4,110 in the short term
"Gold Price Expected to Rebound to $4,110 in the Short Term" 23/10/2025 10:00 Completed
Yesterday, the spot gold price attempted to break through the $4,000 mark several times but was met with strong support. The lowest it reached was $4,004.34 in the early Asian session. Later, it rose to $4,161.39 in the early European session before falling again. In the mid-European session and an hour before the London close, the gold price dropped to $4,015 and $4,011 respectively, but rebounded significantly. It then rose above the $4,100 mark in the mid-New York session and gradually pulled back. After falling below $4,089, it rebounded again. In the early Asian session today, it reached a high of $4,116.35, but clearly encountered resistance at the 45-degree angle of Gann's grid at $4,110.
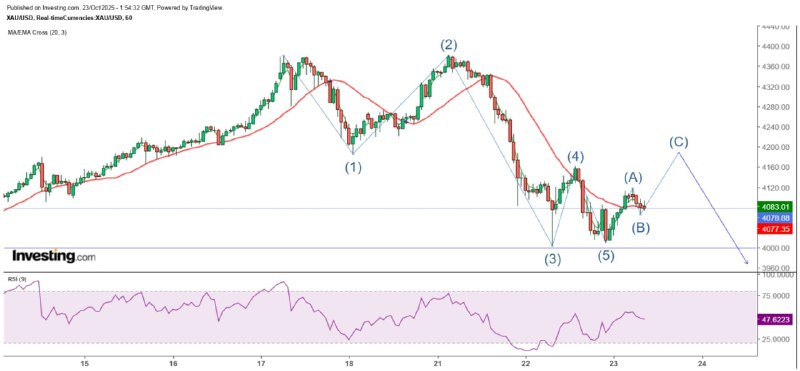
The sudden penetration of 4080 material is a false breakthrough.
Overall, gold prices found initial support at around $4,000. Yesterday marked the first time since August 20th when gold prices broke above the 20-day SMA (currently around $4,036) that they tested below this line. Fortunately, they closed above it. This suggests that after several major adjustments recently, the downward trend may have temporarily halted, and the short-term outlook leans towards a rebound. Notably, this morning, after a sharp drop below $4,080, gold prices did not continue to decline as they had in the past few days. Instead, they bottomed out at $4,066.55 and gradually climbed back to recover all lost ground. This was clearly a false break. Although they later encountered resistance at the 20SMA on the 5-minute chart and fell again, they bottomed out at around $4,072 and rebounded. They then broke above the 20SMA (currently around $4,082) with a strong bullish candle and entered a consolidation phase. Subsequently, they repeatedly tested $4,070 and found support.
Be cautious of a sharp drop after breaking through 4186.
I estimate that the probability of gold price rising repeatedly within the day is relatively high. Although 4000 or 4010 US dollars has become a strong support level, the next level of support is 4066 US dollars. Since 4100 US dollars has been broken through, the resistance at this level has weakened significantly. However, 4110 US dollars is a Gann angle with relatively minor support or resistance, and the possibility of the gold price breaking through this level is high. If so, the gold price will target 4160 US dollars at the 180-degree angle. Judging from the hourly chart trend, the gold price is likely to be in the b-wave correction wave, and then a c-wave rise will occur, breaking through the double top neckline at 4186 US dollars. However, it is likely to then enter a higher-level 3-wave, indicating that the gold price will fall below the 4000 US dollar mark. Assuming that 4187 US dollars is the top of the c-wave and using the same calculation that the 3-wave is 1.618 times the 1-wave, the gold price will fall to 3576.88 US dollars. Currently, the 9RSI on the monthly chart of the gold price is still as high as 95, and it is too early to say that the bottom has been reached.
The above content is for reference only and does not constitute investment advice.
MTF Special Analyst Zheng Guangfu
Previous Article Next Article


