


 Whatsapp
 Telegram
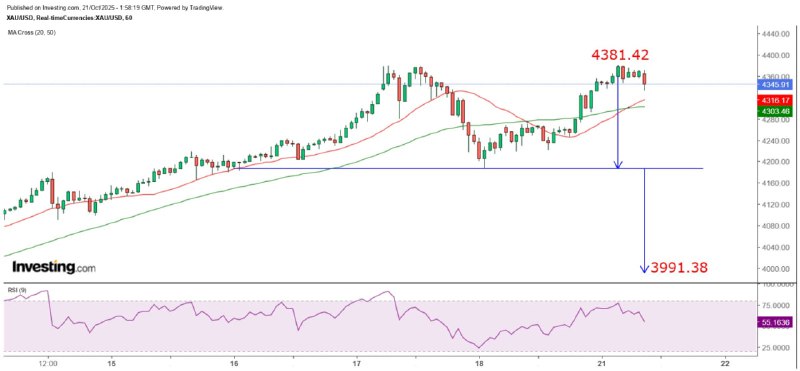
The hourly chart of gold prices shows a large double top
"Gold Price Hourly Chart Shows a Large Double Top" 21/10/2025 9:58 Completed
Yesterday, the gold price continued the upward trend from last Friday. It twice tested the support at $4,220 and then climbed further, eventually breaking through the top of the horizontal range at $4,270. It then broke through the resistance of the 225-degree angle of the Gann Square at $4,310. After a correction, it rose to $4,355 and then entered a sideways pattern. However, in the New York afternoon session, it rose further, reaching a new historical high of $4,381.42. It then dropped sharply and stabilized at $4,346 before rebounding again, but only reached $4,375 before entering a sideways pattern once more.
The $4,000 mark faces strong resistance.
Gold prices remained above $4,360 in the early Asian session today, fluctuating. From the hourly chart, it is clearly seen that a large double top has formed around $4,380. It is expected that another major adjustment will soon take place. Currently, it remains to be seen whether gold prices will move towards the strong resistance at the 90-degree angle of Gann at $4,410 before correcting. If so, the increase in gold prices will exceed $50. However, considering the recent volatility, gold prices still have the potential to rise by another $30 or $50. However, this will inevitably consume the strength of the bulls, so a sideways consolidation is necessary before a new offensive can be launched.
Indians switch to buying silver for Diwali.
I believe that the sharp drop in gold prices last Friday has reflected that the price of $4,000 is considered an unacceptably high level. Reports suggest that India, which traditionally buys gold during Diwali, has switched to buying silver, and gold is even out of stock (not due to high demand but because there is no gold available for sale). This could be an excuse for another major adjustment in gold prices. In fact, I think many investors will find that they no longer have much feeling about the continuous new highs of gold prices and are not as reluctant as before to buy at high prices. This is exactly what I mean: when the big players are ready to sell, there are small investors willing to take over the goods, and the big players can cash out at high prices without the prices being depressed by their large sell orders!
When the 9RSI of the monthly line exceeds 90, a significant decline is inevitable.
From the monthly chart, the 9RSI of gold price has further risen to nearly 96. I still stress that this is a signal of an impending crash. In June 1973, the 9RSI of gold price on the monthly chart reached 96.5, and the gold price peaked at $123.55. However, it dropped to $98.3 in October of the same year, a decline of 20.4%. In January 1980, the 9RSI of gold price on the monthly chart reached 93.5. The gold price peaked at $627 in February, fell to $535 in May, then rose again, and peaked at $629 in October. After that, it dropped sharply, reaching a low of $342.9 in July 1982, with a maximum decline of nearly 45.5%.
This reflects that when the monthly RSI of gold price exceeds 90, the ultimate outcome is a sharp decline. Of course, you may continue to buy gold, but when the reversal signal has emerged, you should think twice before chasing the high gold price. Note that the reversal signal that appeared on the daily chart of gold price last Friday is still valid. Unless the gold price closes above the high of last Friday, the risk of a sharp decline in gold price remains extremely high! There is a chance for gold price to test the neckline of the double top at $4,186 within the day. Once it breaks through, the measured decline target is $3,991.38.
The above content is for reference only and does not constitute investment advice.
MTF Special Analyst Zheng Guangfu
Previous Article Next Article


