


 Whatsapp
 Telegram
The short-term rebound of gold prices is expected to be constrained by 4,280
"Gold Price Short-Term Rebound Expected to Be Capped at 4280" 20/10/2025 9:39 Completed
As the saying goes, "The good ones don't work while the ugly ones do." After the spot gold price approached $4,380 in the Asian market last Friday, it failed to maintain its strength and break through the psychological threshold of $4,400 in the European market. Instead, it dropped sharply in the early afternoon of the Tokyo market after reaching a high of $4,378.73 (the early high was $4,379.29) in a double top formation. Given the gold price's inertia over the past period, it would usually rebound significantly and even reach new highs after the European market opened. However, the gold price remained weak throughout the first half of the European market, leading me to conclude that the correction was not over yet. As a result, the gold price plunged to below $4,200 after the London market closed, hitting a low of $4,186.40 before rebounding continuously. The price dropped by nearly $130 throughout the day.
Gold prices are trapped at two Gann angles.
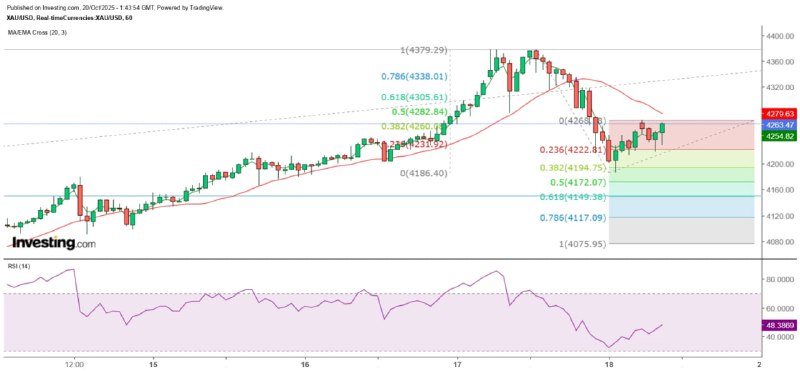
Has the gold price reached a medium-term peak? From the hourly chart, the double top formation of the spot gold price is extremely obvious. Taking 4279.22 US dollars as the neckline level, the measured decline target of the gold price is 4179.15 US dollars, which is close to the low of 4186.4 US dollars made last Friday. Therefore, the short-term rebound of the spot gold price takes 4279.22 US dollars as the first major resistance. From the Gann Square, 4410 US dollars is located at the 90-degree vertical angle, while 4210 US dollars is located at the 180-degree horizontal angle. Both are strong support or resistance levels. Currently, 4210 US dollars is the strong support and 4410 US dollars is the strong resistance.
During the early trading session in Asia today, the spot gold price rebounded to $4,268.18 at one point. However, it fell back in a small double top pattern on the 1-minute chart, reaching a low of $4,219.17 before rebounding significantly. But it was blocked at the $4,250 level and dropped sharply again, stabilizing temporarily at the $4,230 level. Firstly, the current gold price is fluctuating within the Gann Square range of $4,210 to $4,260. Looking at the hourly chart, since last Friday, it has rebounded by more than 41%, slightly more than 38.2%. If it fails to further challenge the neckline of the previous large double top at $4,279.22, the rebound since last Friday will be regarded as a weak rebound, and the price is expected to test the low again in the future.
The mid-term adjustment can be seen at $3,845.
Unless gold prices reach a new high, even if they break through the neckline of the double top and rebound by 61.8% of the biggest decline since last Friday, it is still possible that the medium-term peak has been reached. The current rally in gold prices began after the Federal Reserve Chair Powell's dovish remarks at the Jackson Hole central bank symposium in late August. Taking the previous low of $3,311.46 as the starting point, the medium-term adjustment target is 50% of the biggest increase since then, which is $3,845.38. The resistance for the day includes the neckline of the double top at $4,279.22 on the hourly chart and the 20SMA on the hourly chart (currently around $4,279.41). If the Fibonacci extension line is used to measure the current hourly chart trend, the 100% extension line for the decline is $4,117.09. In other words, it is expected that gold prices will remain in the range of $4,210 to $4,260 for the time being.
The above content is for reference only and does not constitute investment advice.
MTF Special Analyst Zheng Guangfu
Previous Article Next Article


