


 Whatsapp
 Telegram
Gold price at 4210 has turned from resistance to support
"Gold Price: Resistance at 4210 Turns to Support" 16/10/2025 10:04 Completed
It seems that hitting new highs has become a daily occurrence for gold prices. Yesterday, gold prices reversed the significant correction seen on Tuesday. Spot gold dropped sharply near midday in Europe but rebounded strongly after hitting 4165.62 dollars. Technically, it found support at the 20-hour SMA (currently around 4202), and then rose in a volatile manner. It repeatedly tested the 20-hour SMA but rebounded each time, developing in a pattern of higher lows. In the early Asian session today, it even reached a new high of 4227.79 dollars.
The release of selling pressure is beneficial to the gold price.
The ongoing US-China trade war and Powell's dovish remarks are the main reasons for the continuous rise in gold prices. However, the trade war will eventually be resolved, and the interest rate cut was already expected by the market. It is questionable whether gold prices will continue to rise after the rate cut in late October. However, there is an opinion on the sharp drops in gold prices over the past two days. One is that such a sharp drop has wiped out most retail investors, and after a major adjustment, the selling pressure caused by short-term overbuying has been released, so gold prices can resume their upward trend. The other is that such a sharp drop may be due to large investors selling off their holdings. As the saying goes, the more large investors sell, the higher the price goes. Regardless, the volatility of gold prices is increasing, especially in New York. Investors should manage their risks well.
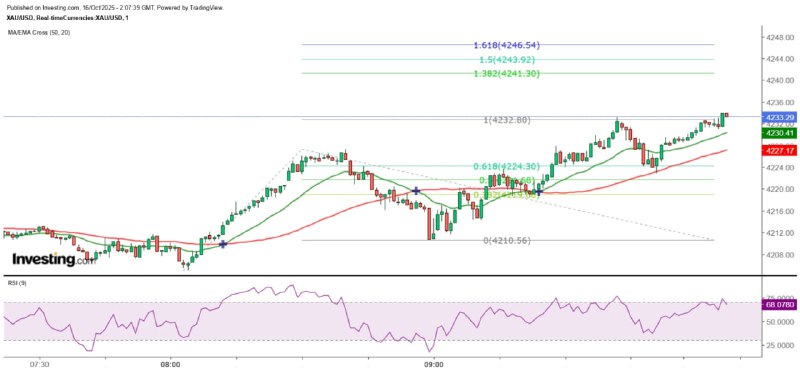
Short-term traders should be cautious of the double top risk.
From the Gann Square perspective, the current gold price is in the range of $4,210 to $4,260. Since $4,210 is a strong support (or resistance), if the gold price has held steady at $4,210, there is a high possibility that it will challenge $4,260 in the near future or even within the day. From the 5-minute chart, it can be seen that the gold price has just completed a Fibonacci 100% extension pattern, but after a pullback to the 20SMA, it has found support and resumed its upward trend. Therefore, it is still possible that it will reach 1.382, 1.5 or 1.618 times before a pullback. In the short term, attention should be paid to the gold price rising to $4,233 or the possible double top divergence after breaking through this level. For the time being, $4,222.9 can be regarded as the neckline. Once it is broken, the measured decline target is $4,212.67, which is close to the important support level of $4,210. At that time, the gold price may start to rise again.
The above content is for reference only and does not constitute investment advice.
MTF Special Analyst Zheng Guangfu
Previous Article Next Article


