


 Whatsapp
 Telegram
Is the Golden party over?
"Is the Gold Party Over?" 10/10/2025 9:41 Completed
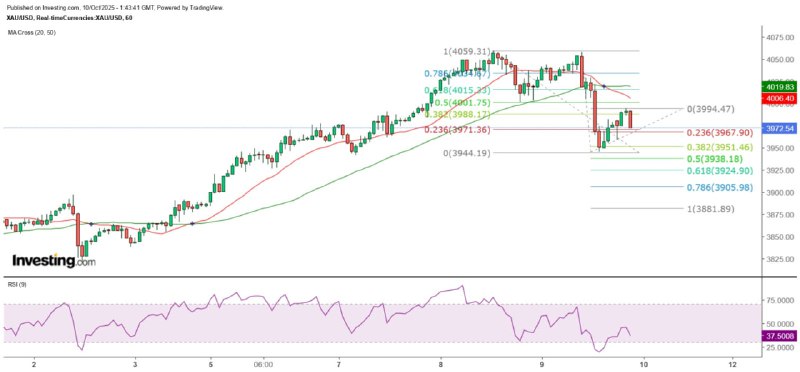
Yesterday, the gold price closed with a single-day reversal and a near bearish engulfing pattern on the daily chart, and the intraday movement was extremely volatile. Spot gold rebounded continuously from the low of $4,001.75 in the early Asian session yesterday until it reached a high of $4,057.98 just before the London close, which was also the highest point of the day. Subsequently, the price of gold plunged sharply, with a decline of over $40 within the first hour. After breaking below $4,000, the decline intensified, and even the psychological support level of $3,950 was briefly breached, hitting a low of $3,945.40. The rebound began after the 9RSI on the hourly chart dropped below 20.
$4,000 turns back into resistance.
From the hourly chart, the gold price showed a very strong piercing pattern one hour after the London market closed. Investors also noticed that since October 7th, its trend has formed a large double top pattern, with the neckline being the low point of 4001.75 dollars made in the early Asian session yesterday. The measured decline target after breaking the neckline is 3944.19 dollars, and the low point of 3945.4 dollars made by the gold price yesterday is very close to this level. In other words, the significant adjustment of the spot gold price yesterday was technically completed in one step, and the possibility of a short-term rebound is relatively high.
The severe overbought condition remains unchanged.
However, the double top neckline at $4001.75 becomes the main resistance for the rebound. Moreover, the single-day reversal pattern on the daily chart also indicates that the possibility of gold prices reaching new highs is extremely slim. Additionally, although the maximum decline in gold prices yesterday was $112.5, the 9RSI on the daily chart still exceeds 73, and the weekly and monthly charts are respectively above 87 and 94. Therefore, the adjustment in gold prices is at most just the beginning!
Short-term fluctuations within $200.
In the early Asian session today, the gold price rose as high as 3995 US dollars, but was clearly blocked near the 4000 US dollar mark. If the movement since yesterday's high is measured by the Fibonacci extension line and the 100% extension is taken into account, the gold price will fall to 3881.89 US dollars. Currently, it seems that 4000 US dollars has changed from support to resistance. From the perspective of Gann's square, the gold price will fluctuate between 3960 and 4010 US dollars. If it breaks through 3960 US dollars, the gold price will drop to the next level, fluctuating between 3910 and 3960 US dollars. However, the support at 3910 US dollars is not very strong, and the stronger support is at 3810 US dollars. Therefore, for a period of time, the gold price is likely to fluctuate between 3810 and 4010 US dollars.
The above content is for reference only and does not constitute investment advice.
MTF Special Analyst Zheng Guangfu
Previous Article Next Article


