


 Whatsapp
 Telegram
Gold prices are trading sideways at a short-term high, awaiting a break
"Gold Price Sideways at Short-Term High, Awaiting Breakout" 29/9/2025 9:28 Completed
Last Friday, the spot gold price finally broke out of the narrowing triangle. The US announced that the PCE in August rose by 2.7% year-on-year, slightly higher than 2.6% in July, while the core PCE rose by 2.9% year-on-year, both in line with market expectations. After the release of the data, the gold price did not show a significant reaction. It then broke out upward, reaching an intraday high of $3,766.28 and further climbing to a high of $3,783.78. However, it failed to reach a new intraday high and retreated in the New York midday session, eventually closing below $3,660.
Silver outperforms gold.
Although gold prices have clearly encountered resistance at high levels, the holdings of the SPDR Gold ETF broke through the 1,000-ton mark last week and increased by another 8.87 tons on Friday, reaching 1,005.72 tons. This may indicate that despite the recent sharp decline in gold prices, there has been no panic selling, and some investors have taken advantage of the lower prices to buy. However, silver performed even better, with the December settlement of silver futures rising by 8.62% for the entire week, while the December settlement of gold futures only rose by 2.78%. This reflects that the gold-silver ratio is further correcting, and it has now dropped to 81.7, far below the highest level of 107 in April, but it still remains at a high level over the past 30 years.
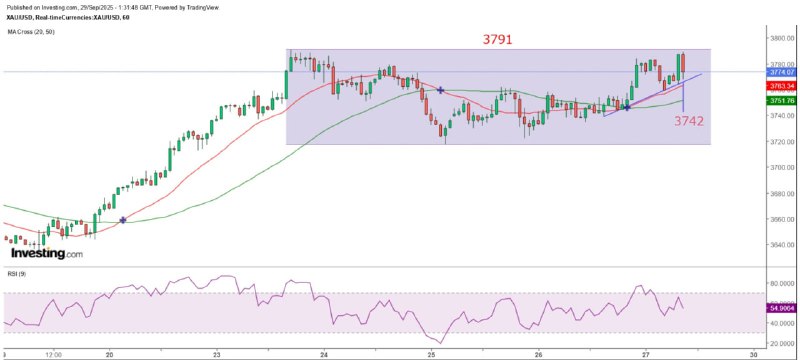
Spot gold prices opened higher in Asia today with a gap, and after two hours of consolidation, they rose sharply, reaching a high of $3,788.86, approaching the historical high of $3,791. However, they then dropped sharply. From the 5-minute chart, it can be seen that after the price surge, a bearish engulfing pattern emerged, indicating heavy selling pressure near the historical high and the psychological level of $3,800. From the hourly chart, the 20SMA ($3,763.5) is expected to provide support, but gold prices also formed a double top pattern, with the bottom support at $3,717.5. Therefore, it is judged that gold prices will remain in a range of $3,760 to $3,810 in the short term. However, if it breaks below $3,760, it is expected to return to a range of $3,710 to $3,760. If $3,710 is breached, the measured decline target is $3,644.
The overbought condition of gold prices has intensified.
Of course, once the gold price breaks through $3,800, it is likely to form a new bottom above that level and prepare for further upward movement. Currently, the volatility of the gold price has intensified, so investors should be prepared for both scenarios. Additionally, apart from the 9RSI on the monthly chart of spot gold rising above 93, the 9RSI on the quarterly chart of futures gold has also reached 91. Therefore, there is still a risk of a sudden sharp decline in the gold price without warning.
The above content is for reference only and does not constitute investment advice.
MTF Special Analyst Zheng Guangfu
Previous Article Next Article


